. 2013:2013:567435.
doi: 10.1155/2013/567435. Epub 2013 Dec 23.

Transcriptionally Repressive Chromatin Remodelling and CpG Methylation in the Presence of Expanded CTG-Repeats at the DM1 Locus

Affiliations

Transcriptionally Repressive Chromatin Remodelling and CpG Methylation in the Presence of Expanded CTG-Repeats at the DM1 Locus

Judith Rixt Brouwer et al. J Nucleic Acids. 2013.

Abstract

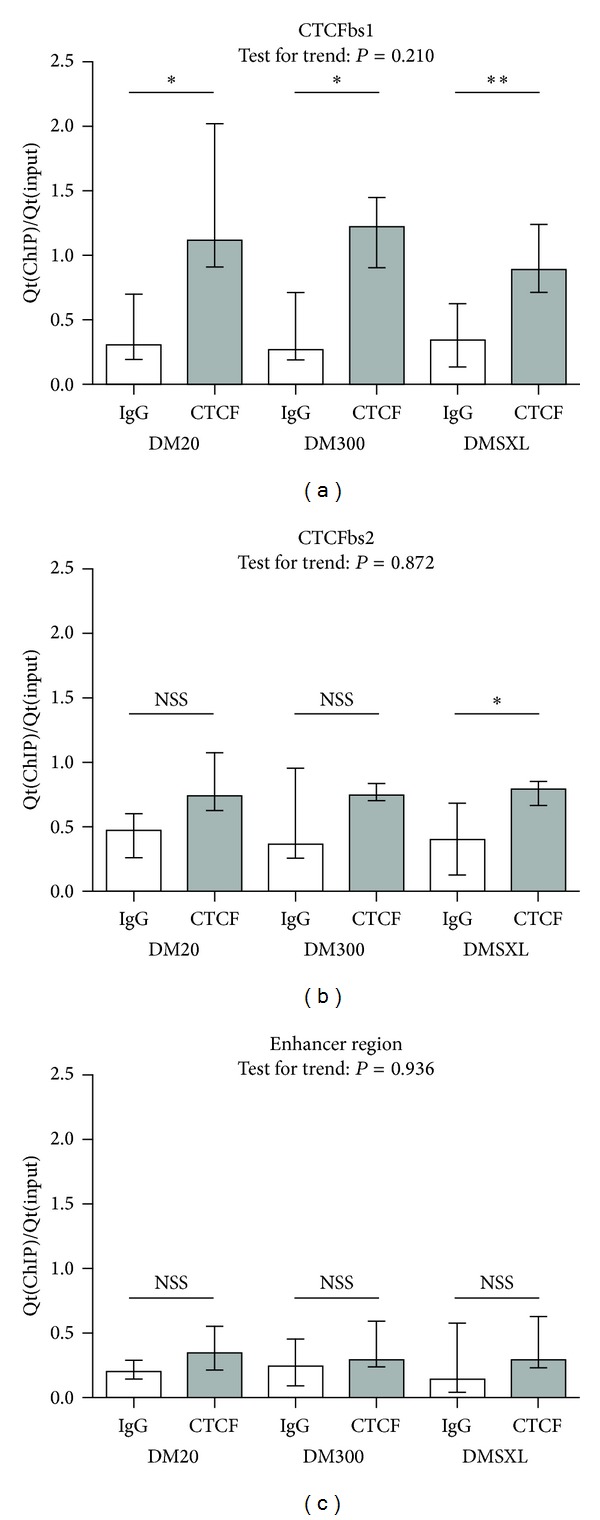
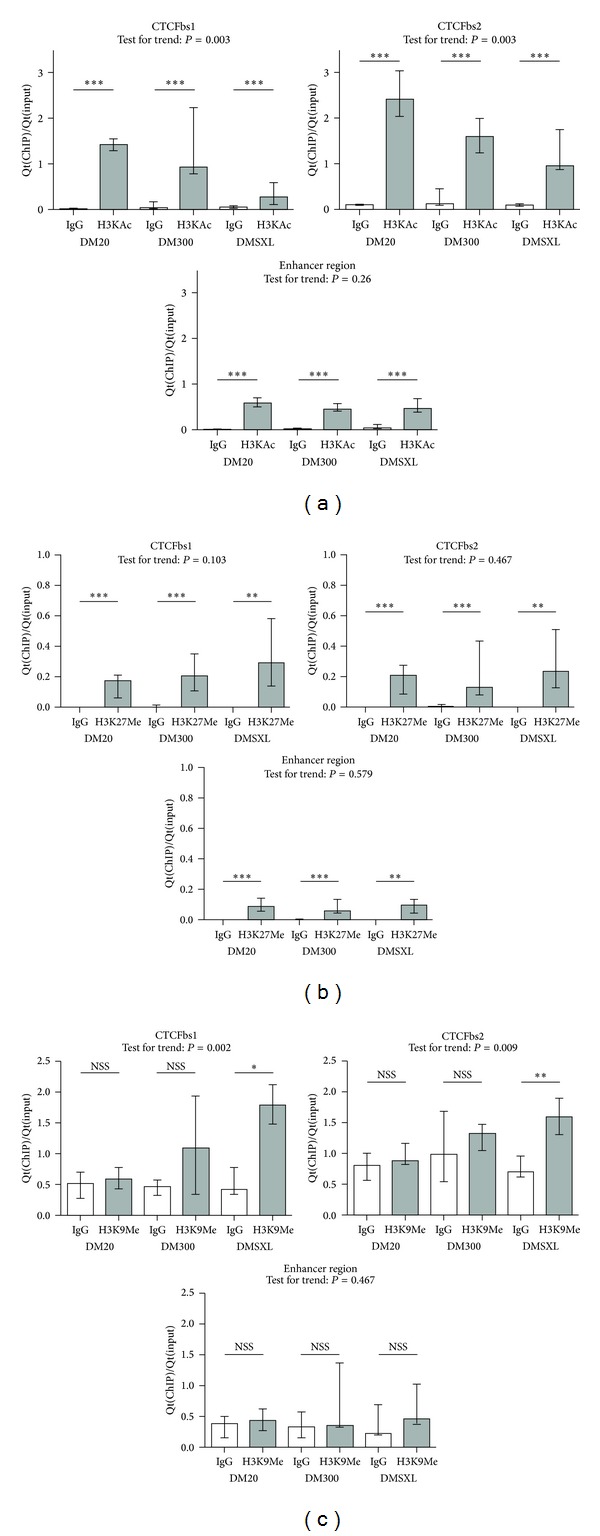
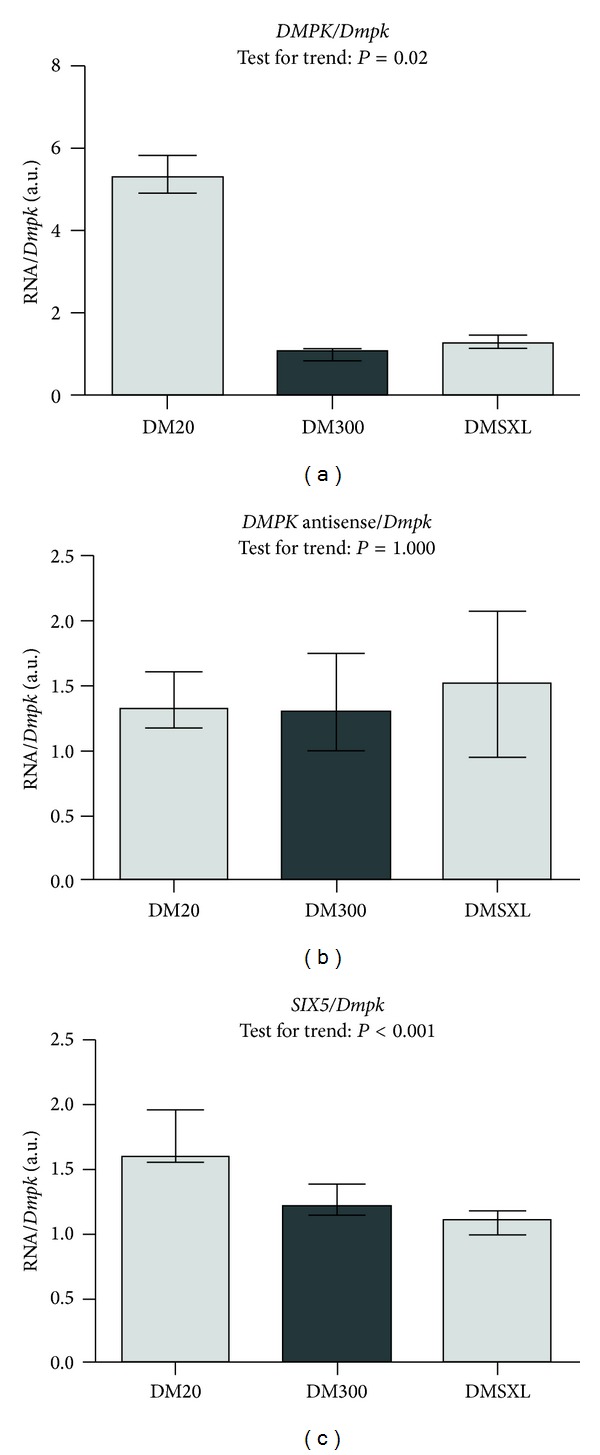
An expanded CTG-repeat in the 3' UTR of the DMPK gene is responsible for myotonic dystrophy type I (DM1). Somatic and intergenerational instability cause the disease to become more severe during life and in subsequent generations. Evidence is accumulating that trinucleotide repeat instability and disease progression involve aberrant chromatin dynamics. We explored the chromatin environment in relation to expanded CTG-repeat tracts in hearts from transgenic mice carrying the DM1 locus with different repeat lengths. Using bisulfite sequencing we detected abundant CpG methylation in the regions flanking the expanded CTG-repeat. CpG methylation was postulated to affect CTCF binding but we found that CTCF binding is not affected by CTG-repeat length in our transgenic mice. We detected significantly decreased DMPK sense and SIX5 transcript expression levels in mice with expanded CTG-repeats. Expression of the DM1 antisense transcript was barely affected by CTG-repeat expansion. In line with altered gene expression, ChIP studies revealed a locally less active chromatin conformation around the expanded CTG-repeat, namely, decreased enrichment of active histone mark H3K9/14Ac and increased H3K9Me3 enrichment (repressive chromatin mark). We also observed binding of PCNA around the repeats, a candidate that could launch chromatin remodelling cascades at expanded repeats, ultimately affecting gene transcription and repeat instability.


Figures

Figure 1
Figure 1
DM1 locus: schematic drawing of the DM1 locus, indicating relevant sites and regions, including the expanded CTG-repeat with flanking CTCF-binding sites (CTCFbs), the DNAse hypersensitive site enhancer of SIX5, and transcription start sites (TSS) of the genes located at the DM1 locus. Approximate locations of amplicons used for bisulfite sequencing and qPCR after ChIP are indicated. The 45 kb fragment of genomic DNA that was used to generate the DM300 transgenic mouse line used in this study contains all of the features indicated in this scheme.
Figure 2
Figure 2
CpG methylation increases with CTG-repeat length. (a) Schematic drawing of the position of the amplicons obtained with seminested PCR, used for bisulfite sequencing, relative to both CTCF-binding sites, the CTG-repeat and exon 15, in the 3′ region of the DMPK transgene. (b) CpG methylation in hearts of adult mice increases with expanding CTG-repeat length. For each repeat length category, 4 mice were used, and per mouse at least 10 clones were sequenced after bisulfite conversion. CpGs are numbered from 5′ to 3′. Shaded CpG numbers lie within the CTCF-binding site recognition sequence. Underlined CpG numbers are CpG dinucleotides that contain G residues essential for recognition by CTCF [19]. Numbers indicate the weighted average percentage of methylation at a particular CpG, seen across all clones in all 4 mice. Colour coding further indicates the approximate degree of methylation at a given CpG. (c) Example of methylation profiles obtained in different clones, representing different cardiac cells of 1 mouse per repeat length category. Individual clones show substantially distinct methylation patterns.
Figure 3
Figure 3
CTCF binds to CTCFbs1, also in the presence of expanded CTG-repeats. These graphs show enrichment ((Qt(IP)/Qt(input), normalised against the abChIP enrichment value of the positive control amplicon of each respective repeat length category) for CTCF in abChIP versus IgG-IP at three regions at the DM1 locus. CTCFbs1 shows statistically significant enrichment for CTCF in abChIP versus IgG-IP in all repeat length categories. No such CTCF-binding is seen at CTCFbs2 or at the enhancer region. Height of the bars indicates median enrichment; error bars indicate the interquartile range (25th to 75th percentile of observations). Mann-Whitney tests were performed to test for a statistically significant difference between the abChIP and IgG reactions. Results are summarised here with * being P < 0.05, ** being P < 0.01, and *** being P < 0.001. Details of the statistical analysis can be found in Supplementary Table 1. Enrichment values obtained for abChIP reactions were subjected to the Jonckheere Terpstra test for trend, which tests whether a trend exists across the categories with increasing CTG-repeat length. P values are indicated in the graphs and details of this statistical analysis can be found in Supplementary Table 2.
Figure 4
Figure 4
Expanded CTG-repeats are associated with local chromatin remodelling towards a less active chromatin conformation around the CTG-repeat. Less occupancy of active histone marks H3K9/14Ac (H3KAc in graph) (a) and more repressive histone marks (H3K9Me3) (c) around CTCFbs1 and bs2 is observed upon CTG-repeat expansion, while enrichment of repressive mark H3K27Me3 (b) is unaffected. These graphs show enrichment (Qt(IP)/Qt(input), normalised against the abCHIP enrichment value of the positive control amplicon of each respective repeat length category) for different histone modifications in abChIP versus IgG-IP at three regions at the DM1 locus. Height of the bars indicates the median enrichment, and error bars indicate the interquartile range (25th to 75th percentile of observations). Mann-Whitney tests were performed to test for a statistically significant difference between the abChIP and IgG reactions. Results are summarised here with * being P < 0.05, ** being P < 0.01, and *** being P < 0.001. Details of the statistical analysis can be found in Supplementary Table 1. The enrichment values obtained for the specific abChIP reactions were subjected to the Jonckheere Terpstra test for trend, which tests whether a trend exists across the categories with increasing CTG-repeat length. P values are indicated in the graphs and details of this statistical analysis can be found in Supplementary Table 2.
Figure 5
Figure 5
Decreased sense transcript levels at the DM1 locus in the presence of expanded CTG-repeats. Upon CTG-repeat expansion, decrease of DMPK sense and SIX5 transcript levels is observed, while DMPK antisense levels are unaffected by CTG-repeat length. These graphs show relative abundance (in arbitrary units) of transcripts of interest, corrected by two different reference genes (18s (a) and endogenous murine Dmpk (b)). Height of bars indicates the median enrichment, and error bars indicate the interquartile range (25th to 75th percentile of observations). Relative abundance values were subjected to the Jonckheere Terpstra test for trend, which tests whether a trend exists across the categories with increasing CTG-repeat length. P values are indicated in the graphs and details of this statistical analysis can be found in Supplementary Table 3.
Figure 6
Figure 6
PCNA seems to bind to expanded CTG-repeats. CTCFbs1 and bs2, but not the enhancer region, show statistically significant enrichment of PCNA in abChIP versus IgG-IP in the expanded CTG-repeat length categories, but not at DM20, suggesting that PCNA binds the expanded CTG-repeat. These graphs show enrichment (Qt(IP)/Qt(input), normalised against the abCHIP enrichment value of the positive control amplicon of each respective repeat length category) for PCNA in abChIP versus IgG-IP at a positive control amplicon and three regions at the DM1 locus. Height of the bars indicates the median enrichment, and error bars indicate the interquartile range (25th to 75th percentile of observations). Mann-Whitney tests were performed to test for a statistically significant difference between the abChIP and IgG reactions. Results are summarised here with * being P < 0.05, ** being P < 0.01, and *** being P < 0.001. Details of the statistical analysis can be found in Supplementary Table 1. The enrichment values obtained for the specific abChIP reactions were subjected to the Jonckheere Terpstra test for trend, which tests whether a trend exists across the categories with increasing CTG-repeat length. P values are indicated in the graphs and details of this statistical analysis can be found in Supplementary Table 2.

References

    1. Brouwer JR, Willemsen R, Oostra BA. Microsatellite repeat instability and neurological disease. BioEssays. 2009;31(1):71–83. - PMC - PubMed
    1. Richards RI, Sutherland GR. Heritable unstable DNA sequences. Nature Genetics. 1992;1(1):7–9. - PubMed
    1. Aslanidis C, Jansen G, Amemiya C, et al. Cloning of the essential myotonic dystrophy region and mapping of the putative defect. Nature. 1992;355(6360):548–551. - PubMed
    1. Brook JD, McCurrach ME, Harley HG, et al. Molecular basis of myotonic dystrophy: expansion of a trinucleotide (CTG) repeat at the 3′ end of a transcript encoding a protein kinase family member. Cell. 1992;68(4):799–808. - PubMed
    1. Fu Y-H, Pizzuti A, Fenwick RG, Jr., et al. An unstable triplet repeat in a gene related to myotonic muscular dystrophy. Science. 1992;255(5049):1256–1258. - PubMed

LinkOut - more resources