Diffusion Tensor Imaging in NAWM and NADGM in MS and CIS: Association with Candidate Biomarkers in Sera
- PMID: 24455265
- PMCID: PMC3877634
- DOI: 10.1155/2013/265259
Diffusion Tensor Imaging in NAWM and NADGM in MS and CIS: Association with Candidate Biomarkers in Sera
Abstract
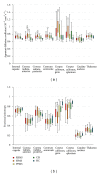
The aim of this study was to evaluate diffusion tensor imaging (DTI) indices in the corpus callosum and pyramidal tract in normal-appearing white matter (NAWM) and the caudate nucleus and thalamus in deep grey matter (NADGM) in all MS subtypes and clinically isolated syndrome (CIS). Furthermore, it was determined whether these metrics are associated with clinical measures and the serum levels of candidate immune biomarkers. Apparent diffusion coefficients (ADC) values were significantly higher than in controls in all six studied NAWM regions in SPMS, 4/6 regions in RRMS and PPMS and 2/6 regions in CIS. In contrast, decreased fractional anisotropy (FA) values in comparison to controls were detected in 2/6 NAWM regions in SPMS and 1/6 in RRMS and PPMS. In RRMS, the level of neurological disability correlated with thalamic FA values (r = 0.479, P = 0.004). In chronic progressive subtypes and CIS, ADC values of NAWM and NADGM were associated with the levels of MIF, sFas, and sTNF- α . Our data indicate that DTI may be useful in detecting pathological changes in NAWM and NADGM in MS patients and that these changes are related to neurological disability.
Figures


Similar articles
-
Intra-voxel and inter-voxel coherence in patients with multiple sclerosis assessed using diffusion tensor MRI.J Neurol. 2002 Jul;249(7):875-83. doi: 10.1007/s00415-002-0752-y. J Neurol. 2002. PMID: 12140672
-
Diffusion tensor analysis of pediatric multiple sclerosis and clinically isolated syndromes.AJNR Am J Neuroradiol. 2013 Feb;34(2):417-23. doi: 10.3174/ajnr.A3216. Epub 2012 Aug 2. AJNR Am J Neuroradiol. 2013. PMID: 22859275 Free PMC article.
-
Hemispheric asymmetry measured by texture analysis and diffusion tensor imaging in two multiple sclerosis subtypes.Acta Radiol. 2015 Jul;56(7):844-51. doi: 10.1177/0284185114539323. Epub 2014 Jul 14. Acta Radiol. 2015. PMID: 25024438
-
Diffusion magnetic resonance imaging of normal-appearing white matter in multiple sclerosis: correlation with brain volume and clinical disability.J Cent Nerv Syst Dis. 2022 May 8;14:11795735221098147. doi: 10.1177/11795735221098147. eCollection 2022. J Cent Nerv Syst Dis. 2022. PMID: 35572123 Free PMC article.
-
The role of diffusion tensor imaging and fractional anisotropy in the evaluation of patients with idiopathic normal pressure hydrocephalus: a literature review.Neurosurg Focus. 2016 Sep;41(3):E12. doi: 10.3171/2016.6.FOCUS16192. Neurosurg Focus. 2016. PMID: 27581308 Review.
Cited by
-
Loss of corticospinal tract integrity in early MS disease stages.Neurol Neuroimmunol Neuroinflamm. 2017 Sep 25;4(6):e399. doi: 10.1212/NXI.0000000000000399. eCollection 2017 Nov. Neurol Neuroimmunol Neuroinflamm. 2017. PMID: 28959706 Free PMC article.
-
Thalamus pathology in multiple sclerosis: from biology to clinical application.Cell Mol Life Sci. 2015 Mar;72(6):1127-47. doi: 10.1007/s00018-014-1787-9. Epub 2014 Nov 23. Cell Mol Life Sci. 2015. PMID: 25417212 Free PMC article. Review.
-
Altered activation of innate immunity associates with white matter volume and diffusion in first-episode psychosis.PLoS One. 2015 May 13;10(5):e0125112. doi: 10.1371/journal.pone.0125112. eCollection 2015. PLoS One. 2015. PMID: 25970596 Free PMC article.
-
Double diffusion encoding MRI for the clinic.Magn Reson Med. 2018 Aug;80(2):507-520. doi: 10.1002/mrm.27043. Epub 2017 Dec 19. Magn Reson Med. 2018. PMID: 29266375 Free PMC article.
-
A DTI study of leukoaraiosis and the differential diagnosis between leukoaraiosis and acute lacunar infarction.CNS Neurosci Ther. 2019 Sep;25(9):1064-1067. doi: 10.1111/cns.13191. Epub 2019 Jul 11. CNS Neurosci Ther. 2019. PMID: 31297957 Free PMC article. No abstract available.
References
-
- Comabella M, Vandenbroeck K. Pharmacogenomics and multiple sclerosis: moving toward individualized medicine. Current Neurology and Neuroscience Reports. 2011;11(5):484–491. - PubMed
-
- Ziemann U, Wahl M, Hattingen E, Tumani H. Development of biomarkers for multiple sclerosis as a neurodegenerative disorder. Progress in Neurobiology. 2011;95(4):670–685. - PubMed
-
- Filippi M, Agosta F. Imaging biomarkers in multiple sclerosis. Journal of Magnetic Resonance Imaging. 2010;31(4):770–788. - PubMed
-
- Cohen JA, Reingold SC, Polman CH, Wolinsky JS. Disability outcome measures in multiple sclerosis clinical trials: current status and future prospects. The Lancet Neurology. 2012;11(5):467–476. - PubMed
LinkOut - more resources
Full Text Sources
Other Literature Sources
Molecular Biology Databases
Miscellaneous

