

Identifying candidate genes for Type 2 Diabetes Mellitus and obesity through gene expression profiling in multiple tissues or cells
- PMID: 24455749
- PMCID: PMC3888709
- DOI: 10.1155/2013/970435
Identifying candidate genes for Type 2 Diabetes Mellitus and obesity through gene expression profiling in multiple tissues or cells
Abstract
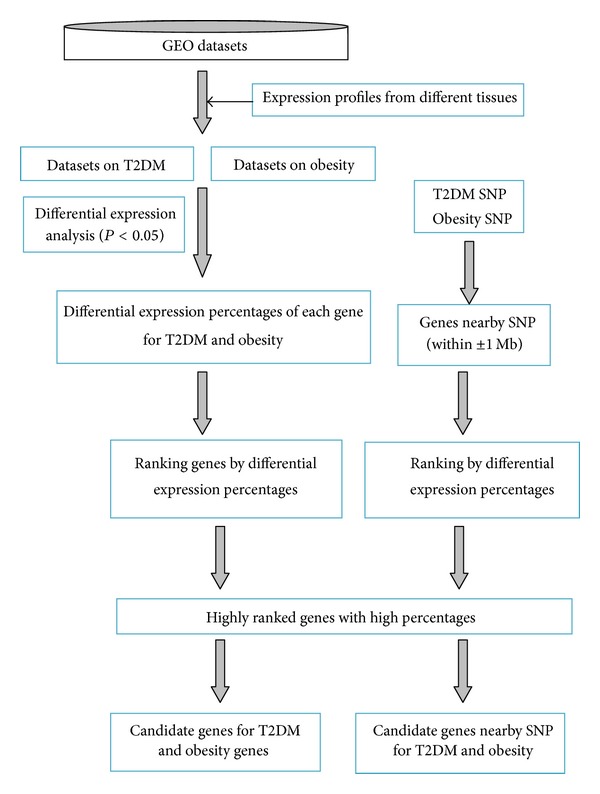
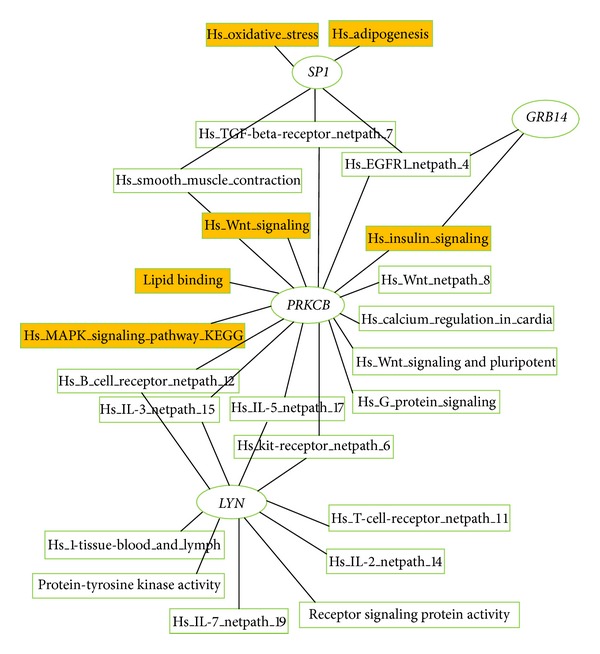
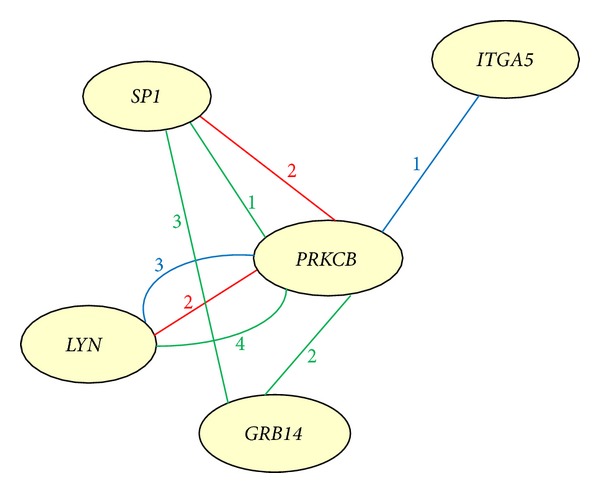
Type 2 Diabetes Mellitus (T2DM) and obesity have become increasingly prevalent in recent years. Recent studies have focused on identifying causal variations or candidate genes for obesity and T2DM via analysis of expression quantitative trait loci (eQTL) within a single tissue. T2DM and obesity are affected by comprehensive sets of genes in multiple tissues. In the current study, gene expression levels in multiple human tissues from GEO datasets were analyzed, and 21 candidate genes displaying high percentages of differential expression were filtered out. Specifically, DENND1B, LYN, MRPL30, POC1B, PRKCB, RP4-655J12.3, HIBADH, and TMBIM4 were identified from the T2DM-control study, and BCAT1, BMP2K, CSRNP2, MYNN, NCKAP5L, SAP30BP, SLC35B4, SP1, BAP1, GRB14, HSP90AB1, ITGA5, and TOMM5 were identified from the obesity-control study. The majority of these genes are known to be involved in T2DM and obesity. Therefore, analysis of gene expression in various tissues using GEO datasets may be an effective and feasible method to determine novel or causal genes associated with T2DM and obesity.
Figures
References
-
- Stumvoll M, Goldstein BJ, Van Haeften TW. Type 2 diabetes: principles of pathogenesis and therapy. The Lancet. 2005;365(9467):1333–1346. - PubMed
-
- West KM, Kalbfleisch JM. Influence of nutritional factors on prevalence of diabetes. Diabetes. 1971;20(2):99–108. - PubMed
-
- Haffner SM, Stern MP, Mitchell BD, Hazuda HP, Patterson JK. Incidence of type II diabetes in Mexican Americans predicted by fasting insulin and glucose levels, obesity, and body-fat distribution. Diabetes. 1990;39(3):283–288. - PubMed
-
- Lillioja S, Mott DM, Spraul M, et al. Insulin resistance and insulin secretory dysfunction as precursors of non- insulin-dependent diabetes mellitus: prospective studies of Pima Indians. The New England Journal of Medicine. 1993;329(27):1988–1992. - PubMed
Publication types
MeSH terms
LinkOut - more resources
Full Text Sources
Other Literature Sources
Medical
Miscellaneous
