. 2014 Jan 23:15:61.
doi: 10.1186/1471-2164-15-61.

Anatomy and transcript profiling of gynoecium development in female sterile Brassica napus mediated by one alien chromosome from Orychophragmus violaceus

Affiliations

Anatomy and transcript profiling of gynoecium development in female sterile Brassica napus mediated by one alien chromosome from Orychophragmus violaceus

Wen-qin Fu et al. BMC Genomics. .

Abstract

Background: The gynoecium is one of the most complex organs of angiosperms specialized for seed production and dispersal, but only several genes important for ovule or embryo sac development were identified by using female sterile mutants. The female sterility in oilseed rape (Brassica napus) was before found to be related with one alien chromosome from another crucifer Orychophragmus violaceus. Herein, the developmental anatomy and comparative transcript profiling (RNA-seq) for the female sterility were performed to reveal the genes and possible metabolic pathways behind the formation of the damaged gynoecium.

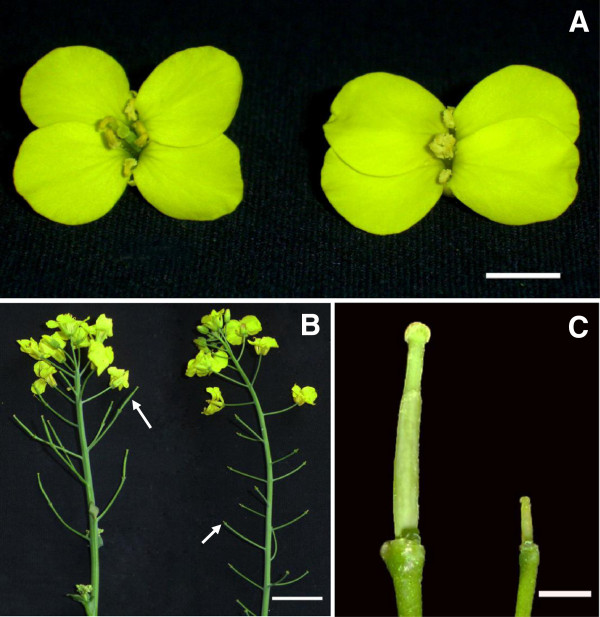
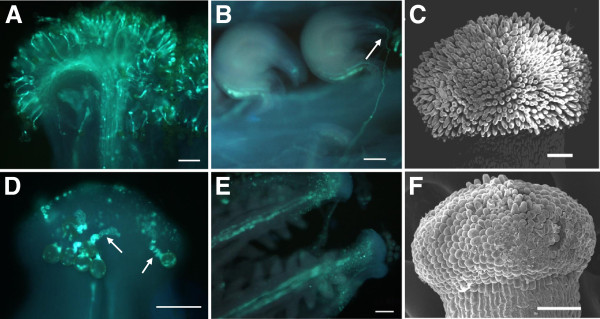
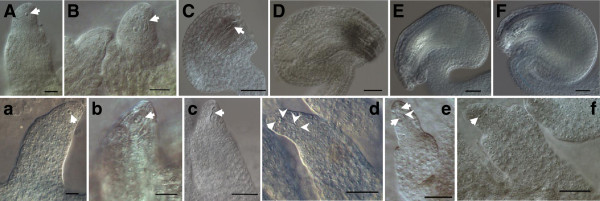
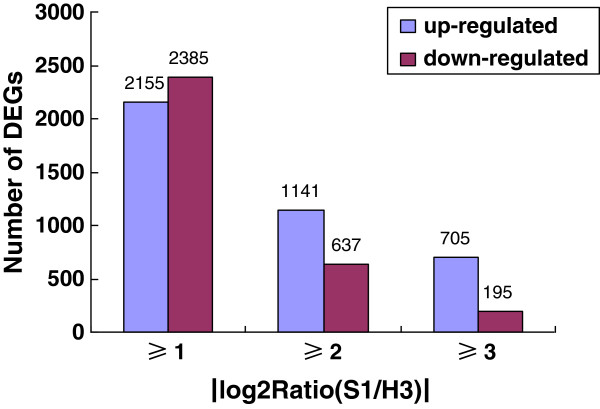
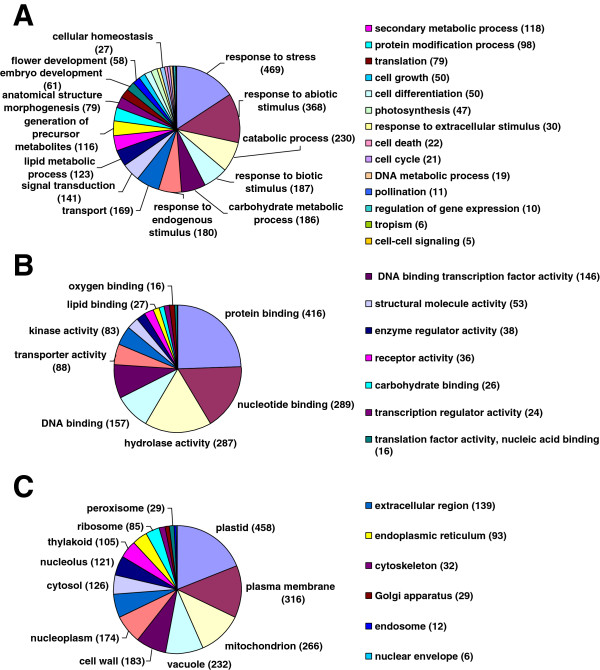
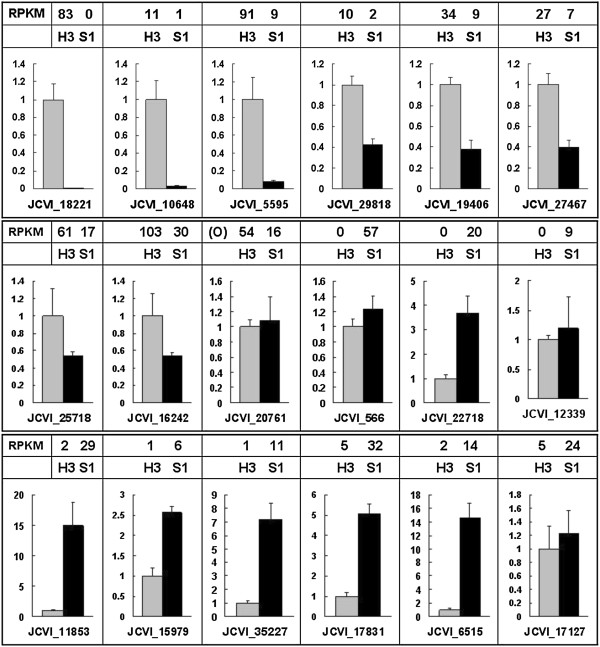
Results: The ovules in the female sterile Brassica napus with two copies of the alien chromosomes (S1) initiated only one short integument primordium which underwent no further development and the female gametophyte development was blocked after the tetrad stage but before megagametogenesis initiation. Using Brassica_ 95k_ unigene as the reference genome, a total of 28,065 and 27,653 unigenes were identified to be transcribed in S1 and donor B. napus (H3), respectively. Further comparison of the transcript abundance between S1 and H3 revealed that 4540 unigenes showed more than two fold expression differences. Gene ontology and pathway enrichment analysis of the Differentially Expressed Genes (DEGs) showed that a number of important genes and metabolism pathways were involved in the development of gynoecium, embryo sac, ovule, integuments as well as the interactions between pollen and pistil.

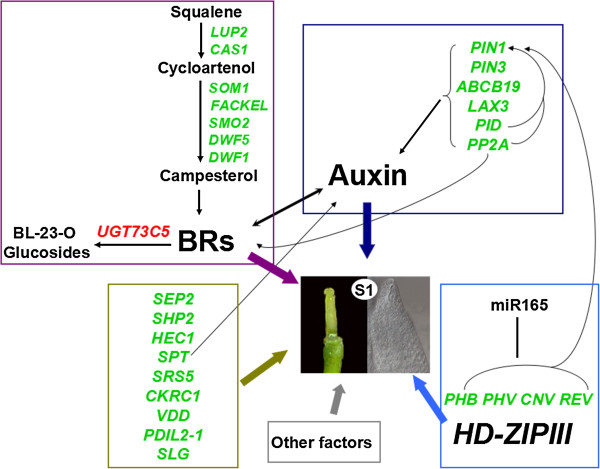
Conclusions: DEGs for the ovule development were detected to function in the metabolism pathways regulating brassinosteroid (BR) biosynthesis, adaxial/abaxial axis specification, auxin transport and signaling. A model was proposed to show the possible roles and interactions of these pathways for the sterile gynoecium development. The results provided new information for the molecular mechanisms behind the gynoecium development at early stage in B. napus.


Figures

Figure 1
Figure 1
Morphology of flower, gynoecium and seed setting in H3 and S1. A, Open flower of H3 (left) and S1 (right), the gynoecium was short and hidden in the stamens in S1, bar = 5 mm. B, Inflorescence of H3 (left) and S1 (right), the arrows indicate the siliques, bar = 20 mm. C, Gynoecium at open flower stage of H3 (left) and S1 (right), the sepals, petals and stamens were removed, bar = 2 mm.
Figure 2
Figure 2
Pollen germination, pollen tube elongation and papilla cells in H3 (A, B and C) and S1 (D, E and F). Pollen grains germinate on stigma of H3 (A) and S1 (D) at 6 h after hand-pollinations, the pollen tubes are screwy (arrows in D) and fail to penetrate into papilla cells in S1. At 72 h after self-pollination, the pollen tubes have passed into the micropyle (arrow in B) of ovule of H3 (B), but no pollen tubes are found in S1 ovary (E). Papilla cells of S1 (F) are much shorter than that of H3 (C). A-B, D-E, Fluorescence micrographs. C and F, Scanning electron micrographs. Bar = 100 μm.
Figure 3
Figure 3
Stages of ovule development in H3 (A-F) and S1 (a-f). Photomicrographs of chloral hydrate cleared ovules. (A, a) MMC has differentiated (arrow) and inner integument has initiated. (B, b) Megaspore tetrad has been produced (arrow) but outer integument primordia form only in H3. (C, c) Postmeiotic ovules. The arrows indicate degenerated haploid spores in S1. In H3 the integuments extend to nucellus, whereas, integument arrests at initiative stage in S1. (D, E, F) Mononuclear, two-nuclear and mature embryo sacs of H3, respectively. (d, e, f) S1 ovules at the same stage as normal mature embryo sac but abnormal nucellus without integument surrounding: one nucleus (arrows) and three degenerated spores (arrowheads) in d, two nuclei (arrows) and a ray of residuum (arrowheads) in e, one small nucleus likely without differentiation (arrow) in f. MMC: Megaspore Mother Cell. Bar = 20 μm in A-B, a-b and 50 μm in C-F, c-f.
Figure 4
Figure 4
Comparison of expression of the mapped genes between S1 and H3. Columns denote the number of DEGs with an expression ratio within the stated range.
Figure 5
Figure 5
Functional categorization of GO terms in DEGs with RPKM ≥ 50 and fold change ≥ 2 by blast2GO. The genes are categorized based on Gene Ontology (GO) annotation and the proportion of each category is displayed based on: Biological process (A); Molecular function (B); Cellular component (C).
Figure 6
Figure 6
RT-PCR confirmation of the differentially expressed genes between H3 (gray columns) and S1 (black columns). Columns and bars represent the means and standard error (n = 3), respectively. The gene expression levels from RNA-Seq data are added on the top of each gene. RPKM: Reads Per Kb per Million reads, O: the change trend of gene expression is the opposite to the result of RNA-Seq.
Figure 7
Figure 7
A proposed model of BR-, auxin-, and HD-ZipIII genes-dependent pathways for gynoecium development. All genes displayed in this figure correspond to DEGs in this study, other related genes without difference are not showed here. Genes with green color are down-regulated and those with red color are up-regulated in S1 pistils. Different colors of rectangle represent different pathway or factors, purple: BRs synthesis and metabolism, dark blue: polar auxin transport, light blue: HD-ZipIII genes, deep yellow: other related genes. Arrows and bars indicate positive and negative regulatory interactions, respectively. BRs: Brassinosteroids. This figure also includes the information from other sources [3,14,37].

References

    1. Kuusk S, Sohlberg JJ, Long JA, Fridborg I, Sundberg E. STY1 and STY2 promote the formation of apical tissues during Arabidopsis gynoecium development. Development. 2002;15(20):4707–4717. - PubMed
    1. Nahar MA, Ishida T, Smyth DR, Tasaka M, Aida M. Interactions of CUP-SHAPED COTYLEDON and SPATULA genes control carpel margin development in Arabidopsis thaliana. Plant Cell Physiol. 2012;15(6):1134–1143. doi: 10.1093/pcp/pcs057. - DOI - PMC - PubMed
    1. Alvarez-Buylla ER, Benítez M, Corvera-Poiré A, Chaos Cador A, de Folter S, Gamboa de Buen A, Garay-Arroyo A, García-Ponce B, Jaimes-Miranda F, Pérez-Ruiz RV, Piñeyro-Nelson A, Sánchez-Corrales YE. Flower development. Arabidopsis Book. 2010;15:e0127. - PMC - PubMed
    1. Ferrándiz C. Regulation of fruit dehiscence in Arabidopsis. J Exp Bot. 2002;15(377):2031–2038. doi: 10.1093/jxb/erf082. - DOI - PubMed
    1. Colombo M, Brambilla V, Marcheselli R, Caporali E, Kater MM, Colombo L. A new role for the SHATTERPROOF genes during Arabidopsis gynoecium development. Dev Biol. 2010;15(2):294–302. doi: 10.1016/j.ydbio.2009.10.043. - DOI - PubMed

Publication types

Associated data