. 2014;48(3):1499-507.
doi: 10.1021/es4048472. Epub 2014 Jan 23.

Inhalable microorganisms in Beijing's PM2.5 and PM10 pollutants during a severe smog event

Affiliations

Inhalable microorganisms in Beijing's PM2.5 and PM10 pollutants during a severe smog event

Chen Cao et al. Environ Sci Technol. 2014.

Abstract

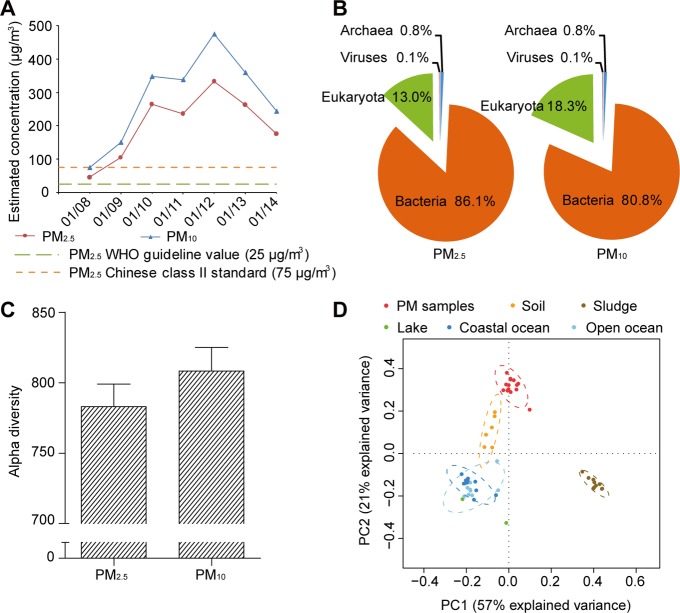
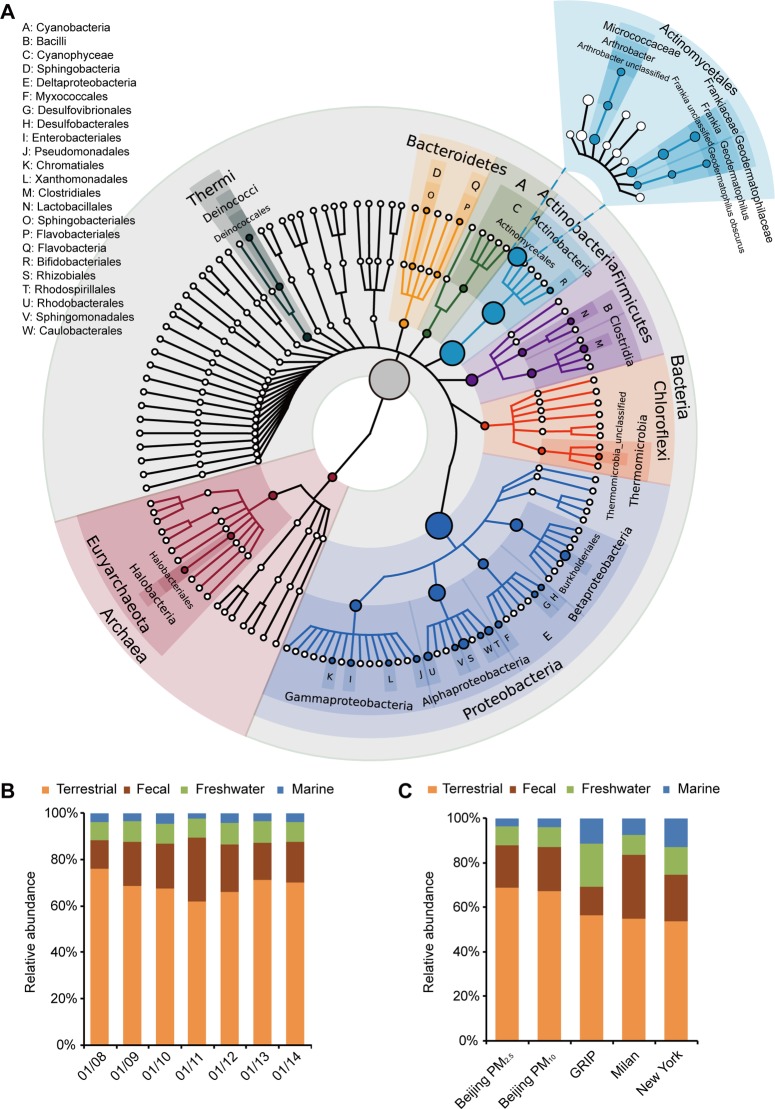
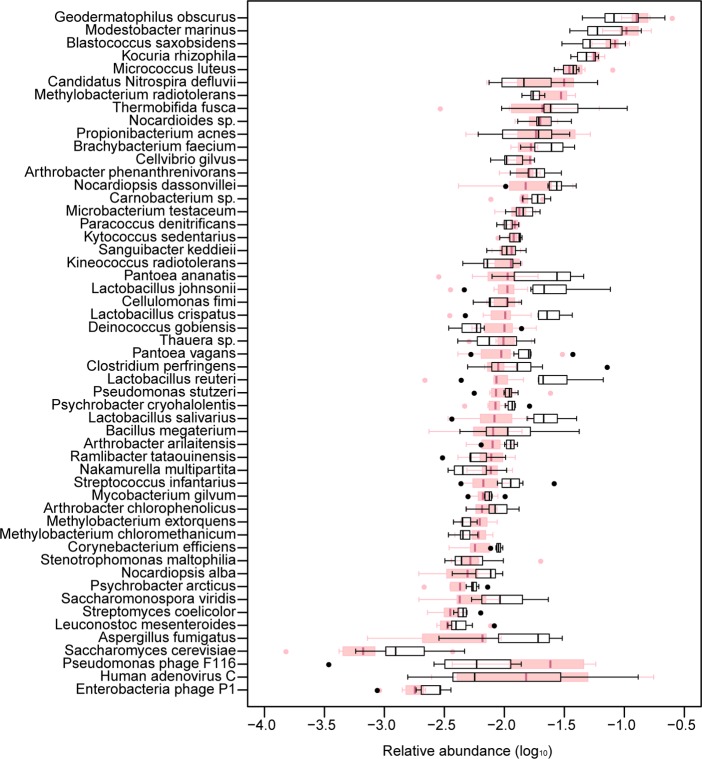
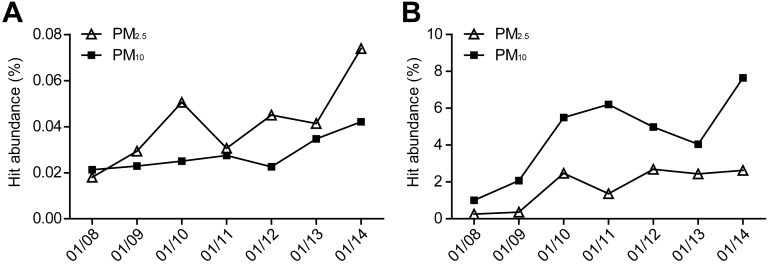
Particulate matter (PM) air pollution poses a formidable public health threat to the city of Beijing. Among the various hazards of PM pollutants, microorganisms in PM2.5 and PM10 are thought to be responsible for various allergies and for the spread of respiratory diseases. While the physical and chemical properties of PM pollutants have been extensively studied, much less is known about the inhalable microorganisms. Most existing data on airborne microbial communities using 16S or 18S rRNA gene sequencing to categorize bacteria or fungi into the family or genus levels do not provide information on their allergenic and pathogenic potentials. Here we employed metagenomic methods to analyze the microbial composition of Beijing's PM pollutants during a severe January smog event. We show that with sufficient sequencing depth, airborne microbes including bacteria, archaea, fungi, and dsDNA viruses can be identified at the species level. Our results suggested that the majority of the inhalable microorganisms were soil-associated and nonpathogenic to human. Nevertheless, the sequences of several respiratory microbial allergens and pathogens were identified and their relative abundance appeared to have increased with increased concentrations of PM pollution. Our findings may serve as an important reference for environmental scientists, health workers, and city planners.


Figures

Figure 1
Figure 1
Characteristics of the collected PM samples and sequenced metagenomes. (A) Daily average PM2.5 and PM10 concentrations estimated from the collected samples during January 8–14, 2013. (B) Relative abundance of the MG-RAST taxonomic hits at the domain level in PM2.5 and PM10 samples. (C) Estimated average alpha diversity of the PM2.5 and PM10 samples (error bars represent SD of the 7 daily PM2.5 and 7 PM10 samples, respectively). (D) Principal component analysis of the relative abundance of microorganisms at the phylum level of the 14 sequenced PM metagenomes (red) compared to those of other environments (other colors).
Figure 2
Figure 2
Bacterial and archaeal species in PM samples and their original habitats. (A) Phylogenetic tree of the bacteria and archaea identified from PM2.5 samples, analyzed by MetaPhlAn. The sizes of the nodes correspond to the relative abundance at the corresponding levels in the cohort. The family, genus, and species levels of the most abundant order Actinomycetales are plotted. Only nodes with ≥1% relative abundance are labeled. (B) Original habitats of the identified bacteria in daily PM2.5 and PM10 samples, categorized by terrestrial, fecal, freshwater, and marine sources. (C) Bacterial and archaeal species in Beijing's PM samples were pooled and compared with those identified from the GRIP high-altitude, Milan urban, and New York subway studies.
Figure 3
Figure 3
Box plot of the daily variations of the relative abundance of 48 most common bacterial, 2 fungal, and 3 viral species in PM samples. Boxes correspond to the interquartile range between the 25th and 75th percentiles, and the central lines represent the 50th percentile. Whiskers correspond to the lowest and highest values no more than 1.5 times the interquartile range from the box, while dots are the outliers beyond the whiskers. PM2.5 samples are labeled pink and PM10 are black.
Figure 4
Figure 4
Daily variations of the normalized hit abundance of microbial pathogens and allergens in the collected PM2.5 and PM10 samples. (A) S. pneumoniae and (B) A. fumigatus.

References

    1. Cheng Z.; Jiang J.; Fajardo O.; Wang S.; Hao J. Characteristics and health impacts of particulate matter pollution in China (2001–2011). Atmos. Environ. 2013, 650186–194.
    1. Ouyang Y. China wakes up to the crisis of air pollution. Lancet Respir. Med. 2013, 1112. - PubMed
    1. Parrish D. D.; Zhu T. Climate change. Clean air for megacities. Science 2009, 3265953674–675. - PubMed
    1. Zhang J.; Mauzerall D. L.; Zhu T.; Liang S.; Ezzati M.; Remais J. V. Environmental health in China: Progress towards clean air and safe water. Lancet 2010, 37597201110–1119. - PMC - PubMed
    1. Zhang Q.; He K.; Huo H. Policy: Cleaning China’s air. Nature 2012, 4847393161–162. - PubMed

Publication types