. 2014 Feb 21;343(6173):896-901.
doi: 10.1126/science.1244634. Epub 2014 Jan 23.

Island cells control temporal association memory

Affiliations

Island cells control temporal association memory

Takashi Kitamura et al. Science. .

Abstract

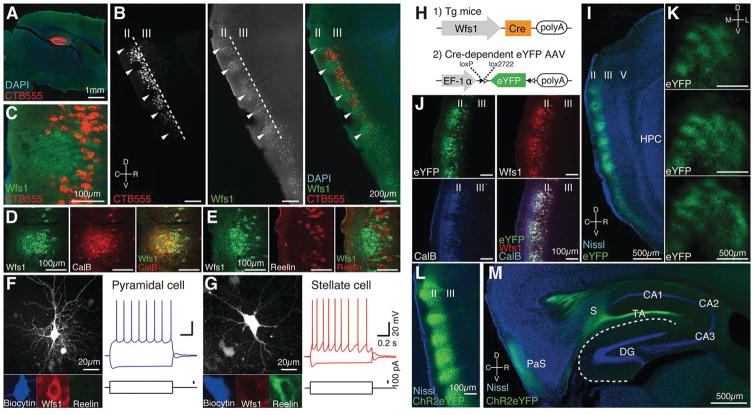
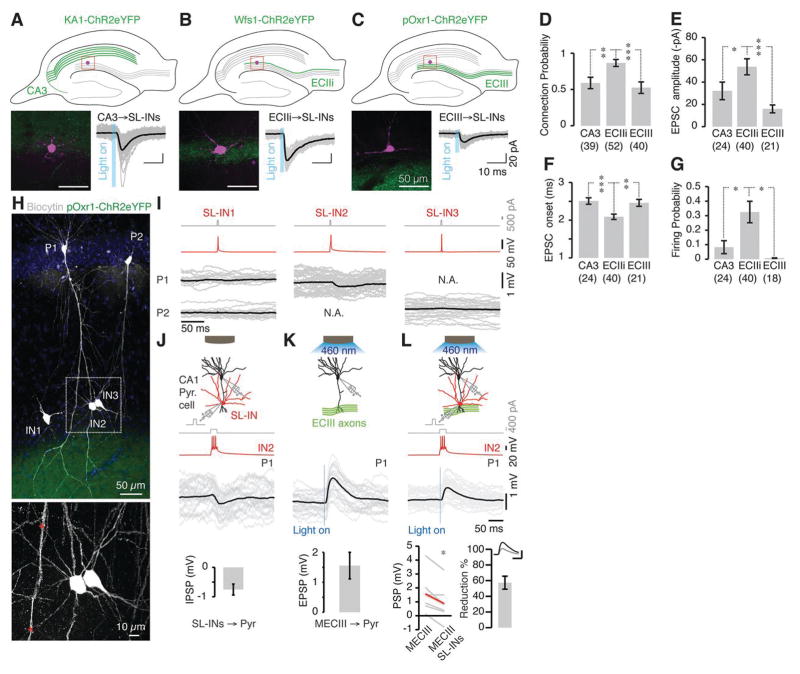
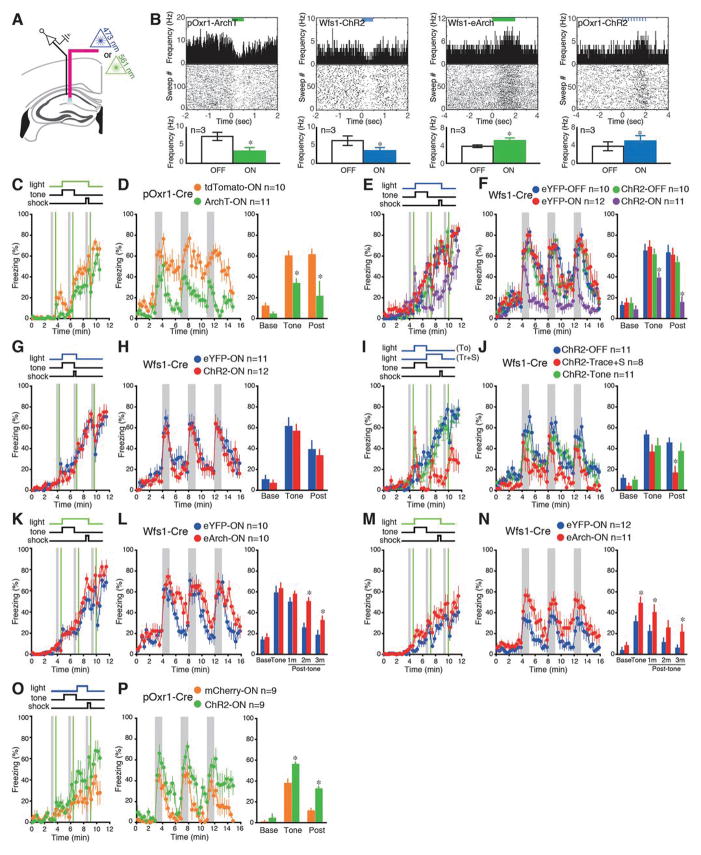
Episodic memory requires associations of temporally discontiguous events. In the entorhinal-hippocampal network, temporal associations are driven by a direct pathway from layer III of the medial entorhinal cortex (MECIII) to the hippocampal CA1 region. However, the identification of neural circuits that regulate this association has remained unknown. In layer II of entorhinal cortex (ECII), we report clusters of excitatory neurons called island cells, which appear in a curvilinear matrix of bulblike structures, directly project to CA1, and activate interneurons that target the distal dendrites of CA1 pyramidal neurons. Island cells suppress the excitatory MECIII input through the feed-forward inhibition to control the strength and duration of temporal association in trace fear memory. Together, the two EC inputs compose a control circuit for temporal association memory.


Figures

Fig. 1
Fig. 1. Characterizations of Island Cells and generation of Wfs1-Cre transgenic mice
(A) Injection sites of CTB (red) in DG. (B) Parasagittal sections of MEC visualized with CTB-labeled cell bodies (red) and immunostained with anti–Wfs1 (green). Arrowheads: Wfs1-positive and CTB-negative ECIIi cells. (C) Magnified image from (B). (D) Parasagittal sections of EC immunostained with anti–Wfs1 (green) and anti-Calbindin D-28K (red). (E) Parasagittal sections of EC immunostained with anti–Wfs1 (green) and anti-Reelin (red). Wfs1-positive cells do not express the Reelin. (F–G) Examples of biocytin-stained Wfs1-positive pyramidal cell (F) and Reelin-positive stellate cell (G). Electrophysiological responses to positive or negative current step injections. (H) Transgenic mouse combined with AAV injection. (I–J) Parasagittal sections of Wfs1-Cre mouse injected with AAV9-EF1α-DIO-eYFP (green) and immunostained with anti-Wfs1 (red) and anti-CalbindinD-28K (blue). (K) Tangential MEC sequential caudo-rostral sections of a Wfs1-Cre mouse injected with AAV9-EF1α-DIO-eYFP. (L–M) Parasagittal sections of a Wfs1-Cre mouse injected with AAV9-EF1α-DIO-ChR2-eYFP. Injection site (EC) (L). Hippocampal innervations (M). TA, temporoammonic pathway; PaS, parasubiculum; S, subiculum, D, dorsal; V, ventral; R, rostral; C, caudal; L, lateral; M, medial.
Fig. 2
Fig. 2. Island Cells project to GABAergic neurons in the Stratum-Lacunosum layer of CA1
(A) Parasagittal HPC section of Wfs1-Cre mouse injected with AAV9-EF1α-DIO-ChR2-eYFP (green) and immunostained with anti-RGS14 (red). (B) Magnification of the boxed area in (A). Stratum-lacunosum (SL) is a component of SLM. (C) Parasagittal section of MECIII-specific pOxr1-Cre mouse injected with AAV9-EF1α-DIO-ChR2-eYFP (green) and immunostained with anti–Wfs1 (violet). Stratum-moleculare (SM) is a component of SLM. (D–E) Parasagittal sections of double transgenic mice, VGAT-ChR2-eYFP crossed with Wfs1-Cre (D), or with pOxr1-Cre (E) crossed injected with AAV9-EF1α-DIO-ChR2-mCherry (red) into EC. (F) Parasagittal section of Wfs1-Cre mouse injected with AAV9-EF1α-DIO-ChR2-mCherry (red) and immunostained by anti-GAD67 (green) and anti-NeuN (blue). Arrowheads: GAD67-positive neurons in the SL. (G) Parasagittal sections of Wfs1-Cre mouse injected with AAV9-EF1α-DIO-Synaptophysin-mCherry (red) as a presynaptic terminal marker and immunostained with anti–VGLUT1 (green). Arrowheads indicate the VGULT1-positive presynaptic terminals of ECIIi cell axons. (H and L) Zeta-projected confocal image of biocytin-filled (violet) SL-IN (H) or CA1 pyramidal cell (L). ECIIi axons (green). (I and M) Optogenetic stimulation of ECIIi axons combined with patch-clamp recordings of SL-INs (I) or CA1 pyramidal cells (M). (J and N) EPSCs elicited in SL-IN (in H) or in CA1 pyramidal cells (in L) in response to optogenetic stimulation of ECIIi axons. (K) Optogenetic stimulation evoked action potential in the SL-IN recorded in current mode at resting membrane potential. (O) Feedforward inhibition in CA1 pyramidal cell recruited by optogenetic stimulation of ECIIi axons. (P) Kinetic of the EPSCs elicited by optogenetic stimulation of ECIIi axons. EPSCs recorded in SL-INs displayed larger amplitude (KS<0.001) and faster onset (KS<0.001) than EPSCs recorded in pyramidal cells. (Q) SL-INs’ average action potential (AP) probability in response to optogenetic stimulations of ECIIi axons. (R) Feedforward inhibition recruited in CA1 pyramidal cells is abolished by bath application of GABA receptor antagonists (Wilcoxon signed-rank P<0.05, n=7). See example in (O). (S) Schematic of the feedforward inhibition. Thickness of the lines indicates connection strength.
Fig. 3
Fig. 3. Inhibition of ECIII input to CA1 by Island Cells through SL-GABAergic neurons
(A–C) Expression of ChR2-eYFP (green) in CA3-specific (A), ECIIi-specific (B) and MECIII specific (C) transgenic mice. SL-INs stained by biocytin (violet). Voltage clamp recording of light evoked EPSCs in SL-INs following optogenetic stimulation of CA3 (A), ECIIi (B) or MECIII (C) axons. (D–G) Connection probability (Fisher exact test **P<0.005, ***P<0.001, D), EPSC amplitude (Wilcoxon sum rank *P<0.05, ***P<0.001, E), EPSC onset (Wilcoxon sum rank **P<0.005, ***P<0.001, F), firing probability (Fisher exact test *P<0.05, G) in response to optogenetic stimulation of CA3, ECIIi or MECIII axons. (H) Zeta-projected confocal image of biocytin-filled SL-INs (IN1, IN2, IN3) and CA1 pyramidal cells (P1, P2). MECIII axons (green). Inset from the dotted-line box: putative contact points between IN2 and P1 (red asterisks). (I) Connectivity matrix of cells displayed in H. Only IN2-P1 showed IPSPs. (J) Schematic, raw traces and average amplitude (n=8 pairs) of the IPSPs evoked in P1 by stimulation of IN2. (K) Schematic, raw traces and average amplitude (n=8 pairs) of the EPSPs evoked in P1 by optogenetic stimulation of MECIII fibers. (L) Schematic and raw traces showing the response recorded in P1 to simultaneous stimulation of MECIII axons and IN2. Note the reduction elicited by the simultaneous stimulation when compared to optogenetic stimulation of MECIII axons only (Wilcoxon signed-rank *P<0.05, n=8 pairs, average in red).
Fig. 4
Fig. 4. Effects of optogenetic axonal excitation and inhibition on behavior
(A) in vivo multiunit recording in anaesthetized mice combined with optogenetic axonal excitation or inhibition. (B) Upper panels: example of light-induced excitations or inhibitions of CA1 multiunit activity in the pOxr1/ArchT, Wfs1/ChR2, Wfs1/eArch, pOxr1/ChR2 anaesthetized mice. Lower panels: the averaged data of the firing frequency of CA1 pyramidal cells during light-OFF and light-ON periods (n=3 mice each group) (C–D) Time course of freezing observed in ArchT-expressing pOxr1-Cre mice and control mice in the TFC during training on day 1 (C) and testing on day 2 (D). Gray and green bars represent tone and shock, respectively. In the right panel of (D) and corresponding panels hereafter, freezing levels during the testing were averaged over the three 60-s tone periods and over the three first 60-s post-tone periods. (E–H) Time course of freezing observed in ChR2-eYFP-expressing, and eYFP only-expressing Wfs1-Cre mice in TFC (E–F) and DFC (G–H) during training on day 1 (E, G) and testing on day 2 (F, H). In (G), blue light was delivered during training periods (22 s). (I–J) Blue light was delivered during tone periods (20 s) or trace+shock periods (22 s). Time courses of freezing observed in ChR2-expressing Wfs1-Cre mice in TFC during training on day 1 (I) or testing on day 2 (J). (K–N) Time course of freezing observed in eArch-eYFP expressing, and eYFP only-expressing Wfs1-Cre mice in TFC (K–L), and weak TFC (M–N) during training on day 1 (K, M) and testing on day 2 (L, N). In the right panels of (L) and (N) freezing levels during testing on day 2 averaged over the first, second and third 60-s post-tone periods. (O–P) Time course of freezing observed in ChR2mCherry expressing, and mCherry only-expressing pOxr1-Cre mice in weak TFC during training on day 1 (O) and testing on day 2 (P). *P<0.05.

Comment in

References

    1. Tulving E. Annu Rev Psychol. 2002;531 - PubMed
    1. Eichenbaum H. Nat Rev Neurosci. 2000 Oct;141 - PubMed
    1. Hargreaves EL, Rao G, Lee I, Knierim JJ. Science. 2005 Jun 17;3081792 - PubMed
    1. Marr D. Philos Trans R Soc Lond B Biol Sci. 1971 Jul 1;26223 - PubMed
    1. Nakazawa K, et al. Science. 2002 Jul 12;297211

Publication types