

Density and abundance of badger social groups in England and Wales in 2011-2013
- PMID: 24457532
- PMCID: PMC3899851
- DOI: 10.1038/srep03809
Density and abundance of badger social groups in England and Wales in 2011-2013
Abstract
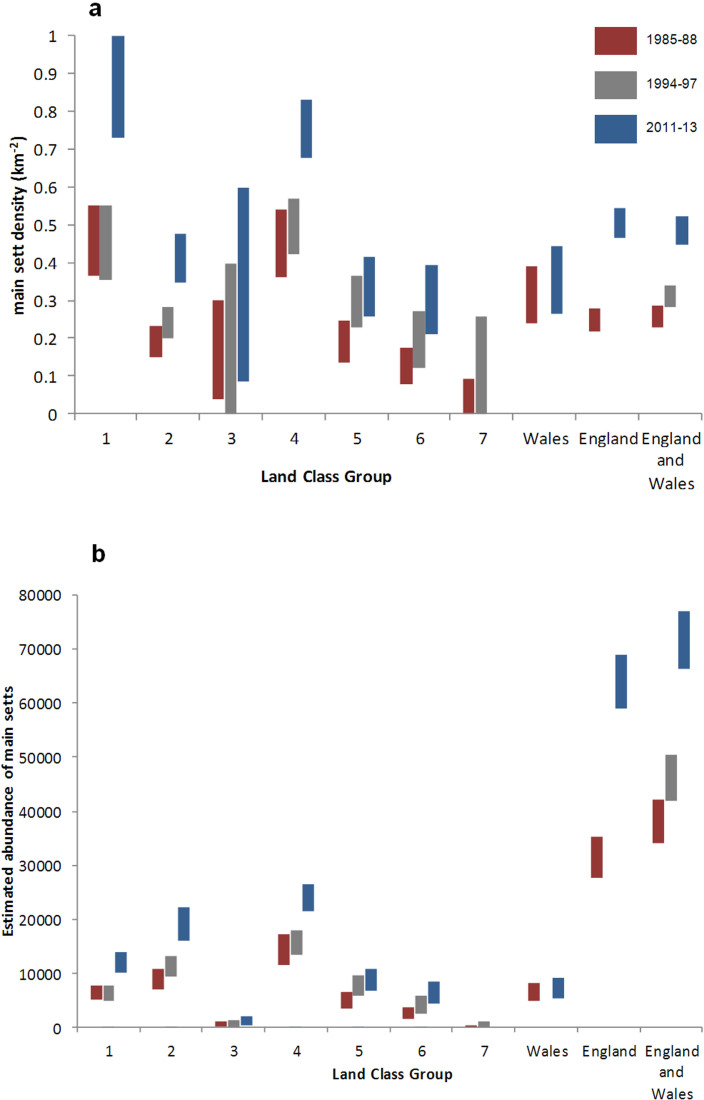
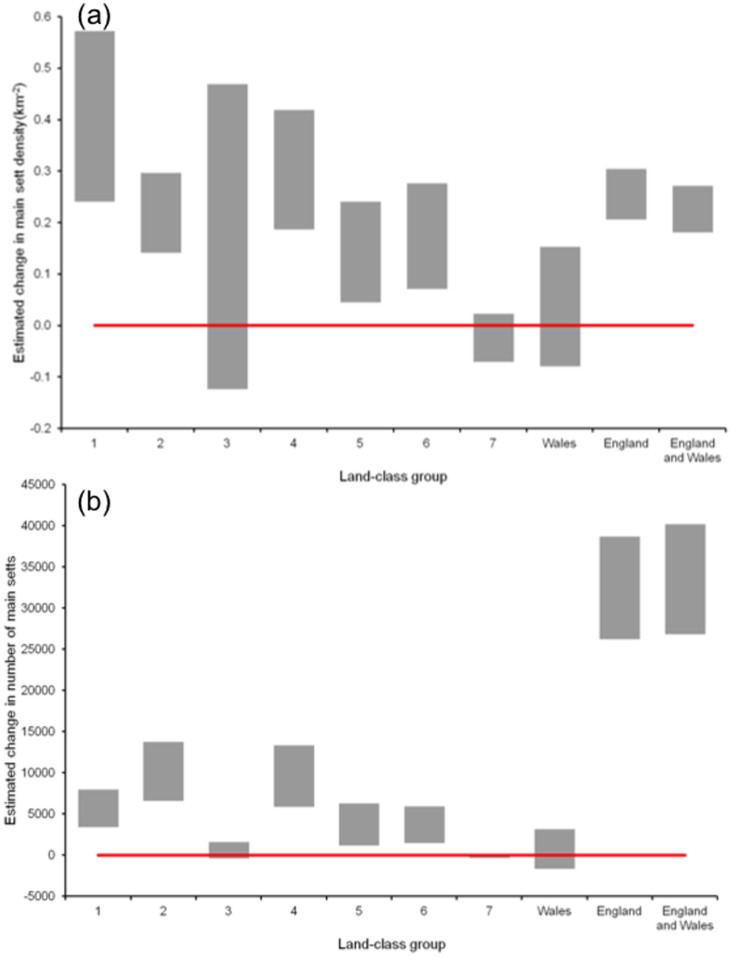
In the United Kingdom, European badgers Meles meles are a protected species and an important wildlife reservoir of bovine tuberculosis. We conducted a survey of badger dens (main setts) in 1614 1 km squares across England and Wales, between November 2011 and March 2013. Using main setts as a proxy for badger social groups, the estimated mean density of badger social groups in England and Wales was 0.485 km(-2) (95% confidence interval 0.449-0.521) and the estimated abundance of social groups was 71,600 (66,400-76,900). In the 25 years since the first survey in 1985-88, the annual rate of increase in the estimated number of badger social groups was 2.6% (2.2-2.9%), equating to an 88% (70-105%) increase across England and Wales. In England, we estimate there has been an increase of 103% (83-123%) in badger social groups, while in Wales there has been little change (-25 to +49%).
Figures
Similar articles
-
Estimating the risk of cattle exposure to tuberculosis posed by wild deer relative to badgers in England and Wales.J Wildl Dis. 2009 Oct;45(4):1104-20. doi: 10.7589/0090-3558-45.4.1104. J Wildl Dis. 2009. PMID: 19901384
-
Model of Selective and Non-Selective Management of Badgers (Meles meles) to Control Bovine Tuberculosis in Badgers and Cattle.PLoS One. 2016 Nov 28;11(11):e0167206. doi: 10.1371/journal.pone.0167206. eCollection 2016. PLoS One. 2016. PMID: 27893809 Free PMC article.
-
Bovine tuberculosis and badgers in Britain: relevance of the past.Epidemiol Infect. 2013 Jul;141(7):1437-44. doi: 10.1017/S095026881200297X. Epub 2013 Jan 25. Epidemiol Infect. 2013. PMID: 23347609 Free PMC article.
-
Mycobacterium bovis: characteristics of wildlife reservoir hosts.Transbound Emerg Dis. 2013 Nov;60 Suppl 1:1-13. doi: 10.1111/tbed.12115. Transbound Emerg Dis. 2013. PMID: 24171844 Review.
-
Can badger vaccination contribute to bovine TB control? A narrative review of the evidence.Prev Vet Med. 2025 May;238:106464. doi: 10.1016/j.prevetmed.2025.106464. Epub 2025 Feb 14. Prev Vet Med. 2025. PMID: 39983381 Review.
Cited by
-
Predicting badger visits to farm yards and making predictions available to farmers.PLoS One. 2019 May 24;14(5):e0216953. doi: 10.1371/journal.pone.0216953. eCollection 2019. PLoS One. 2019. PMID: 31125349 Free PMC article.
-
An assessment of a conservation strategy to increase garden connectivity for hedgehogs that requires cooperation between immediate neighbours: A barrier too far?PLoS One. 2021 Nov 5;16(11):e0259537. doi: 10.1371/journal.pone.0259537. eCollection 2021. PLoS One. 2021. PMID: 34739512 Free PMC article.
-
Molecular Detection of Arthropod-Borne Pathogens in Eurasian Badgers (Meles meles) from the United Kingdom.Animals (Basel). 2020 Mar 6;10(3):446. doi: 10.3390/ani10030446. Animals (Basel). 2020. PMID: 32155963 Free PMC article.
-
Environmental risk factors associated with bovine tuberculosis among cattle in high-risk areas.Biol Lett. 2015 Nov;11(11):20150536. doi: 10.1098/rsbl.2015.0536. Biol Lett. 2015. PMID: 26559511 Free PMC article.
-
Abundance of badgers (Meles meles) in England and Wales.Sci Rep. 2017 Mar 21;7(1):276. doi: 10.1038/s41598-017-00378-3. Sci Rep. 2017. PMID: 28325904 Free PMC article.
References
-
- Cassidy A. Vermin, victims and disease: UK framings of badgers in and beyond the bovine TB controversy. Sociol. Rural. 52, 192–214; 10.1111/j.1467-9523.2012.00562.x (2012).
-
- Gortazar C. et al. The status of tuberculosis in European wild mammals. Mammal Rev. 42, 193–206; 10.1111/j.1365-2907.2011.00191.x (2012).
-
- Donnelly C. A. et al. Impact of localized badger culling on tuberculosis incidence in British cattle. Nature 426, 834–837; 10.1038/nature02192 (2003). - PubMed
-
- Donnelly C. A. et al. Positive and negative effects of widespread badger culling on tuberculosis in cattle. Nature 439, 843–846; 10.1038/nature04454 (2006). - PubMed
Publication types
MeSH terms
LinkOut - more resources
Full Text Sources
Other Literature Sources
