. 2014 Jan 23;5(1):e1012.
doi: 10.1038/cddis.2013.543.

Integrin inhibition promotes atypical anoikis in glioma cells

Affiliations

Integrin inhibition promotes atypical anoikis in glioma cells

M Silginer et al. Cell Death Dis. .

Abstract

Integrins regulate cellular adhesion and transmit signals important for cell survival, proliferation and motility. They are expressed by glioma cells and may contribute to their malignant phenotype. Integrin inhibition may therefore represent a promising therapeutic strategy. GL-261 and SMA-560 glioma cells grown under standard conditions uniformly detached and formed large cell clusters after integrin gene silencing or pharmacological inhibition using EMD-121974, a synthetic Arg-Gly-Asp-motif peptide, or GLPG0187, a nonpeptidic integrin inhibitor. After 120 h, the clusters induced by integrin inhibition decayed and cells died. In contrast, when cells were cultured under stem cell (sphere) conditions, no disaggregation became apparent upon integrin inhibition, and cell death was not observed. As poly-HEMA-mediated detachment had similar effects on cell viability as integrin inhibition, we postulated that cell death may result from detachment alone, which was confirmed using various permissive and nonpermissive substrates. No surrogate markers of apoptosis were detected and electron microscopy confirmed that necrosis represents the dominant morphology of detachment-induced cell death. In addition, integrin inhibition resulted in the induction of autophagy that represents a survival signal. When integrins were inhibited in nonsphere glioma cells, the TGF-β pathway was strongly impaired, whereas no such effect was observed in glioma cells cultured under sphere conditions. Cell death induced by integrin inhibition was rescued by the addition of recombinant transforming growth factor-β (TGF-β) and accelerated by exposure to the TGF-β receptor inhibitor, SD-208. In summary, cell death following integrin inhibition is detachment mediated, represents an atypical form of anoikis involving necrosis as well as autophagy, and is modulated by TGF-β pathway activity.


Figures
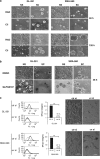
Figure 1
Figure 1
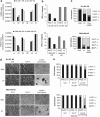
Integrin inhibition induces detachment of mouse NS cells. (a) GL-261 or SMA-560 cells cultured under standard (NS) or sphere (SC) conditions were seeded at 200 000 cells/well, and after 24 h were exposed to control peptide (RAD) or cilengitide (10 μM) (scale bar, 100 μm). (b) GL-261 (left) or SMA-560 (right) NS cells or SCs were exposed to DMSO control or GLPG0187 (1 nM) for 24 h (scale bar, 100 μm). (c) GL-261 NS cells (top) or SMA-560 NS cells (bottom) were transfected with control or αv integrin siRNA. Gene silencing was quantified after 24 h by flow cytometry and is expressed as specific fluorescence index (SFI; left). The reduction of expression levels relative to control transfectants is indicated (middle). The transfected cells were monitored for attachment for 24 h (right, scale bar, 200 μm)
Figure 2
Figure 2
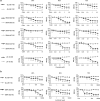
Sphere formation protects from cell death induced by αv integrin inhibition. (a) GL-261, SMA-560, SMA-497, SMA-540 or LN-18 glioma NS cells or SCs were exposed to RAD (10 μM) or increasing concentrations of cilengitide as indicated for 24, 48 or 72 h. Metabolic activity was assessed by MTT assay and is indicated relative to RAD-treated cells. (b) GL-261 or SMA-560 NS cells or SCs were exposed to DMSO or to increasing concentrations of GLPG0187 as indicated for 24, 48 or 72 h. Metabolic activity was assessed by MTT assay and is indicated relative to control-treated cells. (c) SMA-560 or GL-261 NS cells or SCs were exposed to RAD or cilengitide (10 μM) for 48 h. Cell death was assessed by annexin V/PI staining. (d) SMA-560 and GL-261 NS cells or SCs were exposed to GLPG0187 (1 nM) or DMSO control for 48 h and analyzed for cell death by annexin V/PI staining. (e) GL-261 (top) and SMA-560 (bottom) control and αv knockdown transfectants were analyzed for cell death 24 h after transfection by annexin V/PI staining
Figure 2
Figure 2
Sphere formation protects from cell death induced by αv integrin inhibition. (a) GL-261, SMA-560, SMA-497, SMA-540 or LN-18 glioma NS cells or SCs were exposed to RAD (10 μM) or increasing concentrations of cilengitide as indicated for 24, 48 or 72 h. Metabolic activity was assessed by MTT assay and is indicated relative to RAD-treated cells. (b) GL-261 or SMA-560 NS cells or SCs were exposed to DMSO or to increasing concentrations of GLPG0187 as indicated for 24, 48 or 72 h. Metabolic activity was assessed by MTT assay and is indicated relative to control-treated cells. (c) SMA-560 or GL-261 NS cells or SCs were exposed to RAD or cilengitide (10 μM) for 48 h. Cell death was assessed by annexin V/PI staining. (d) SMA-560 and GL-261 NS cells or SCs were exposed to GLPG0187 (1 nM) or DMSO control for 48 h and analyzed for cell death by annexin V/PI staining. (e) GL-261 (top) and SMA-560 (bottom) control and αv knockdown transfectants were analyzed for cell death 24 h after transfection by annexin V/PI staining
Figure 3
Figure 3
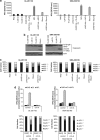
The induction of cell death caused by integrin inhibition is detachment mediated. (a) Integrin mRNA levels were assessed by real-time PCR in GL-261 or SMA-560 NS cells or SCs. (b) The αv protein levels were assessed by flow cytometry in NS cells or SCs exposed to RAD or cilengitide (10 μM) for 24 h. (c) GL-261 NS cells or SMA-560 NS cells were exposed to RAD or cilengitide (10 μM) or cultured on cell culture dishes pretreated with poly-HEMA (12 mg/ml) for 48 h. Cell death was assessed by annexin V/PI staining. (d) GL-261 NS cells or SMA-560 NS cells cultured on plates coated with collagen I or collagen IV or poly-D-lysine (control) were allowed to attach for 24 h. Subsequently, the cells were exposed to RAD or cilengitide (10 μM) for 48 h and monitored for attachment (scale bar, 100 μm). (e) Viability of cells treated as in (d) was examined by annexin V/PI staining
Figure 4
Figure 4
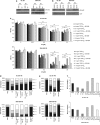
Integrin inhibition-induced cell death in mouse NS cells does not require caspase activity. (a) GL-261 NS cells (left) or SMA-560 NS cells (right) were exposed to RAD, cilengitide (1 or 10 μM), MFL (50 ng/ml), staurosporine (50 nM), zVAD-fmk (10 μM) or to combinations thereof for 6 h. DEVD-amc cleaving activity was determined fluorometrically. (b) Whole-cell protein lysates of GL-261 NS or SMA-560 NS exposed to RAD, cilengitide (1 or 10 μM) or staurosporine (50 nM) for 24 h were assessed for full-length and cleaved caspase 3, using actin as a loading control. (c) GL-261 NS cells or SMA-560 NS cells were exposed to RAD, cilengitide (10 μM), zVAD-fmk (1 μM), staurosporine (50 nM), or to a combination of zVAD-fmk (1 μM) and cilengitide (10 μM) or staurosporine (50 nM). Viability was assessed after 24 h of treatment by annexin V/PI staining. (d) Control or crm-A transfectants were exposed to RAD, cilengitide (10 μM) or MFL (50 ng/ml) for 6 h and analyzed for DEVD-amc-cleaving caspase activity (top). Cell death was assessed by annexin V/PI staining after exposure to RAD or cilengitide (10 μM) for 24 h (bottom)
Figure 5
Figure 5
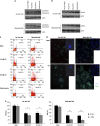
Cilengitide-treated mouse glioma NS cells show signs of autophagy. (a and b) Whole-cell protein lysates of GL-261 NS cells and SMA-560 NS cells exposed to RAD, cilengitide (10 or 50 μM) or salinomycin (4 μM) for 24 h were analyzed for LC3A/B (a) or beclin-1 (b) using actin as a loading control. (c) GL-261 or SMA-560 NS cells were exposed to RAD, cilengitide (10 or 50 μM) or salinomycin (4 μM) for 24 h. The development of AVOs was assessed by acridine orange staining. (d) GL-261 or SMA-560 NS cells were exposed to RAD or cilengitide (10 μM) for 24 h. Autophagic vacuoles were stained with MDC (green; nucleus, blue). (e) GL-261 or SMA-560 NS cells were treated with 3-MA (1 mM) for 60 min followed by RAD or cilengitide (10 or 50 μM) for 48 h. Metabolic activity was assessed by MTT assay and is indicated relative to RAD-treated cells
Figure 6
Figure 6
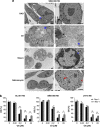
Cilengitide-treated mouse glioma NS cells undergo necrosis. (a) SMA-560 NS cells were exposed to RAD, cilengitide (10 μM), staurosporine (1 μM) or salinomycin (5 μM) as indicated for 48 h and monitored by TEM. Images in the right column of each panel show a magnified part of the images on the left. Cells binding to each other are indicated with blue arrows, blue stars point to necrosis-like cell debris, blue arrowheads to crescent DNA along the nucleus, red arrows to swollen mitochondria and red arrowheads to autophagosomes (scale bar, 2 μm). (b) GL-261 or SMA-560 NS cells were treated with Nec-1 (100 μM) for 60 min followed by increasing concentrations of cilengitide as indicated for 72 h. Metabolic activity was assessed by MTT assay and is indicated relative to control cells not preexposed to Nec-1
Figure 7
Figure 7
TGF-β2 counteracts integrin inhibition-induced cell death. (a) GL-261 (left) or SMA-560 (right) NS cells or SCs were exposed to RAD or cilengitide (10 μM). (b) GL-261 (left) or SMA-560 (right) NS cells or SCs were exposed to DMSO or GLPG0187 (1 nM). Subsequently, whole-cell protein lysates were assessed for pSmad2 levels by immunoblot, using actin as a loading control. (c) GL-261 NS cells or SMA-560 NS cells were exposed to combinations of cilengitide and TGF-β2 as indicated with or without SD-208 (1 μM). Metabolic activity was assessed using MTT assay. (d) GL-261 NS cells or SMA-560 NS cells were exposed to RAD, cilengitide (10 μM), TGF-β2 (10 ng/ml) or a combination of cilengitide (10 μM) and increasing concentrations of TGF-β2 as indicated for 48 h. Viability was assessed by annexin V/PI staining. (e) GL-261 NS cells or SMA-560 NS cells were exposed to RAD, cilengitide (10 μM), SD-208 (1 μM) or a combination of cilengitide (10 μM) and SD-208 (1 μM) for 48 h. Cell viability was assessed by annexin V/PI staining. (f) The αv protein levels were assessed by flow cytometry in GL-261 NS cells or SMA-560 NS cells exposed to RAD (10 μM), cilengitide (1 or 10 μM), TGF-β2 (1 or 10 ng/ml) or SD-208 (1 μM) for 48 h

Similar articles

Cited by

References

    1. Arnaout MA, Goodman SL, Xiong JP. Structure and mechanics of integrin-based cell adhesion. Curr Opin Cell Biol. 2007;19:495–507. - PMC - PubMed
    1. Humphries JD, Byron A, Humphries MJ. Integrin ligands at a glance. J Cell Sci. 2006;119:3901–3903. - PMC - PubMed
    1. Desgrosellier JS, Cheresh DA. Integrins in cancer: biological implications and therapeutic opportunities. Nat Rev Cancer. 2010;10:9–22. - PMC - PubMed
    1. Mitra SK, Schlaepfer DD. Integrin-regulated FAK-Src signaling in normal and cancer cells. Curr Opin Cell Biol. 2006;18:516–523. - PubMed
    1. Aoudjit F, Vuori K. Matrix attachment regulates Fas-induced apoptosis in endothelial cells: a role for c-flip and implications for anoikis. J Cell Biol. 2001;152:633–643. - PMC - PubMed