. 2014 Jan 23;5(1):e1023.
doi: 10.1038/cddis.2013.560.

A cell-penetrating peptide based on the interaction between c-Src and connexin43 reverses glioma stem cell phenotype

Affiliations

A cell-penetrating peptide based on the interaction between c-Src and connexin43 reverses glioma stem cell phenotype

E Gangoso et al. Cell Death Dis. .

Abstract

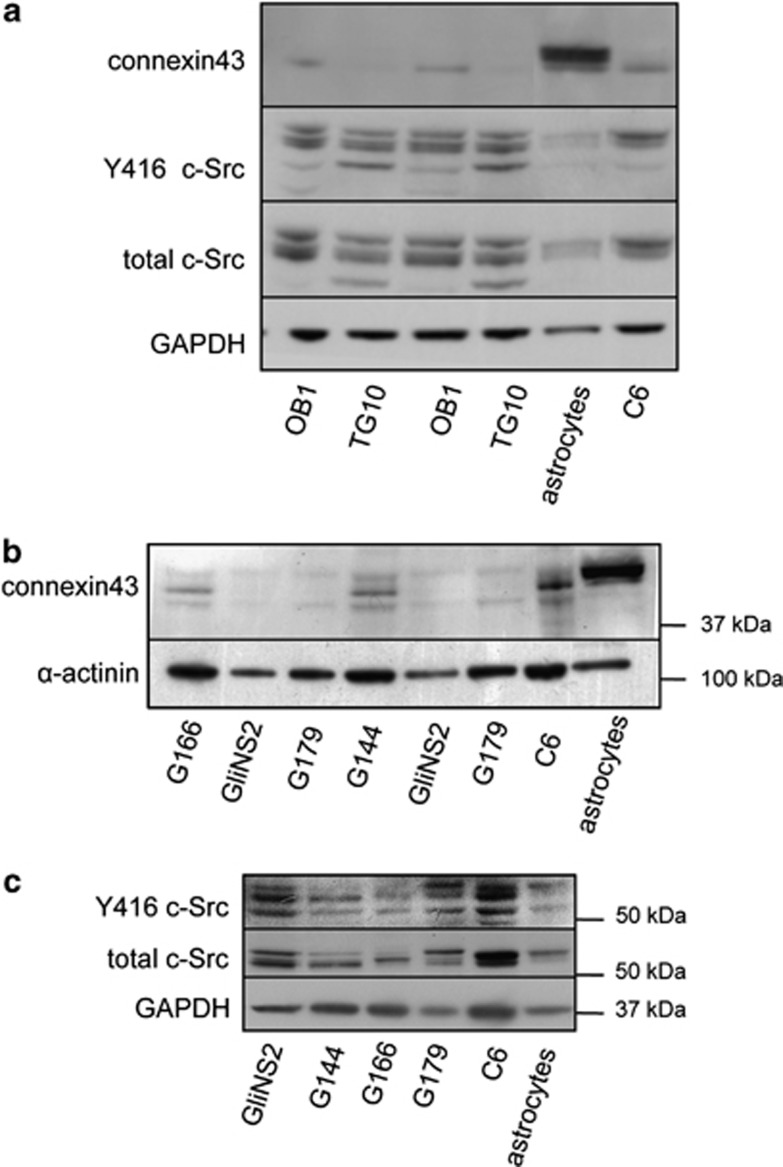
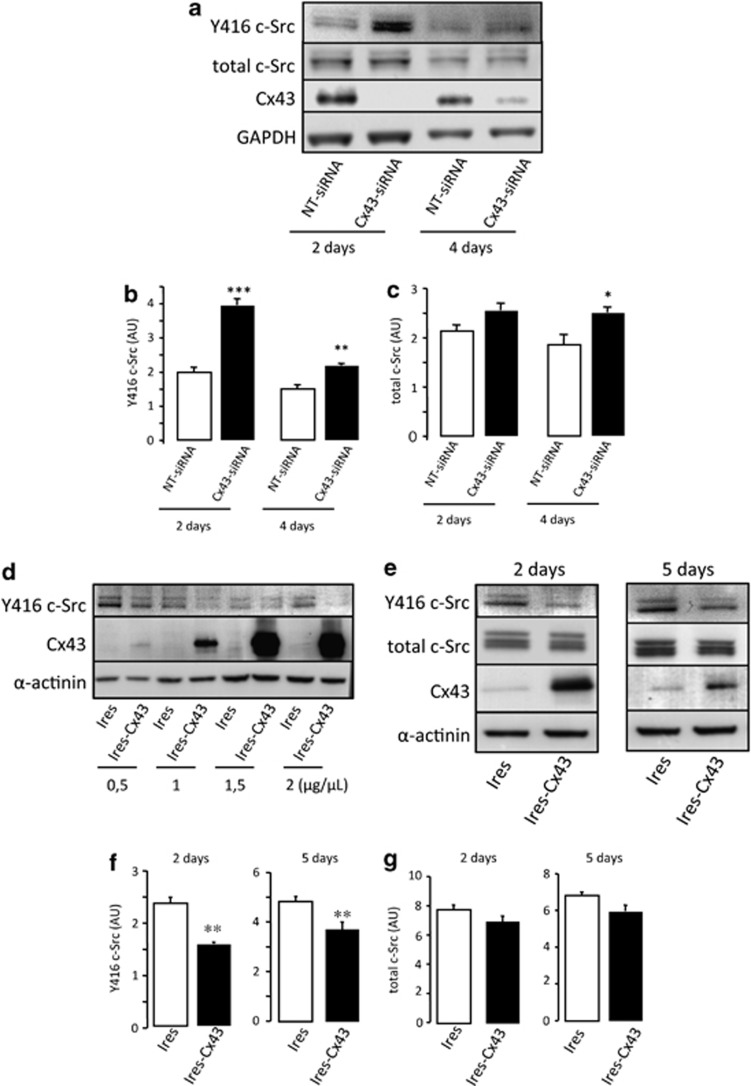
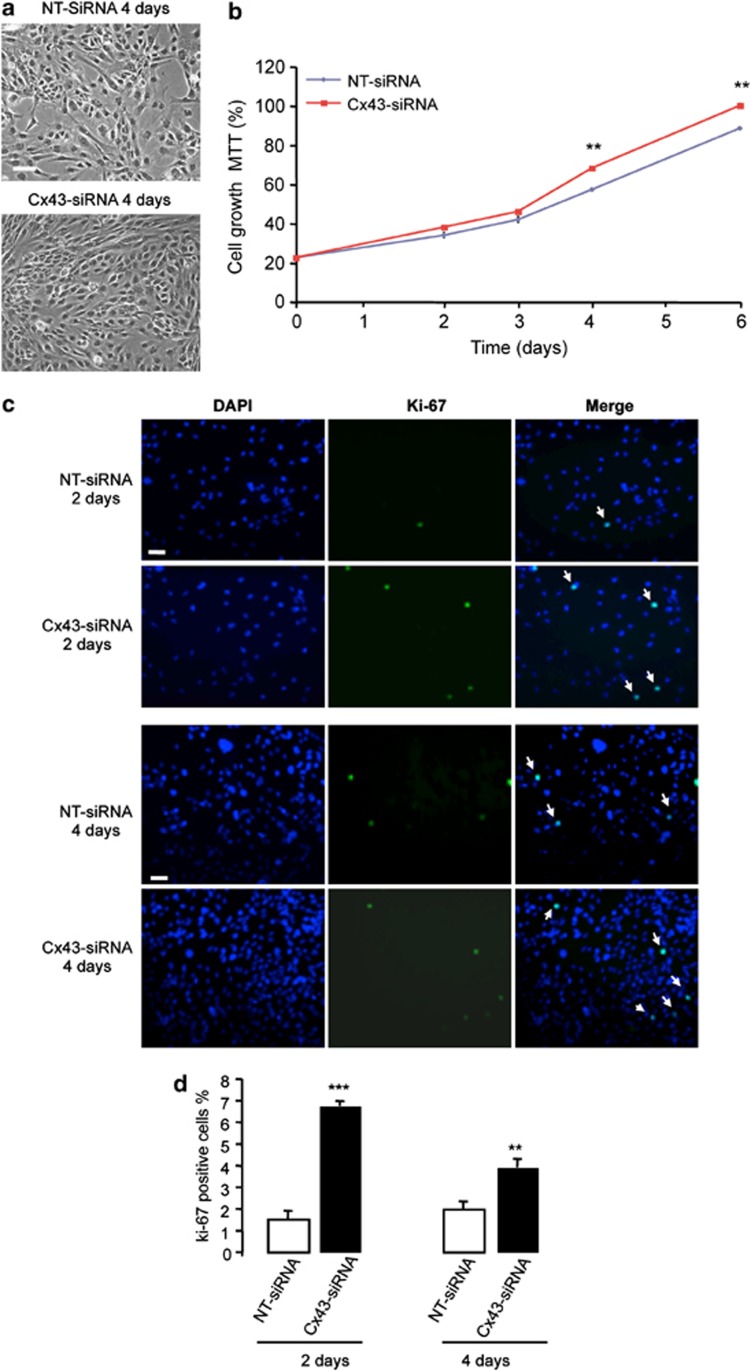
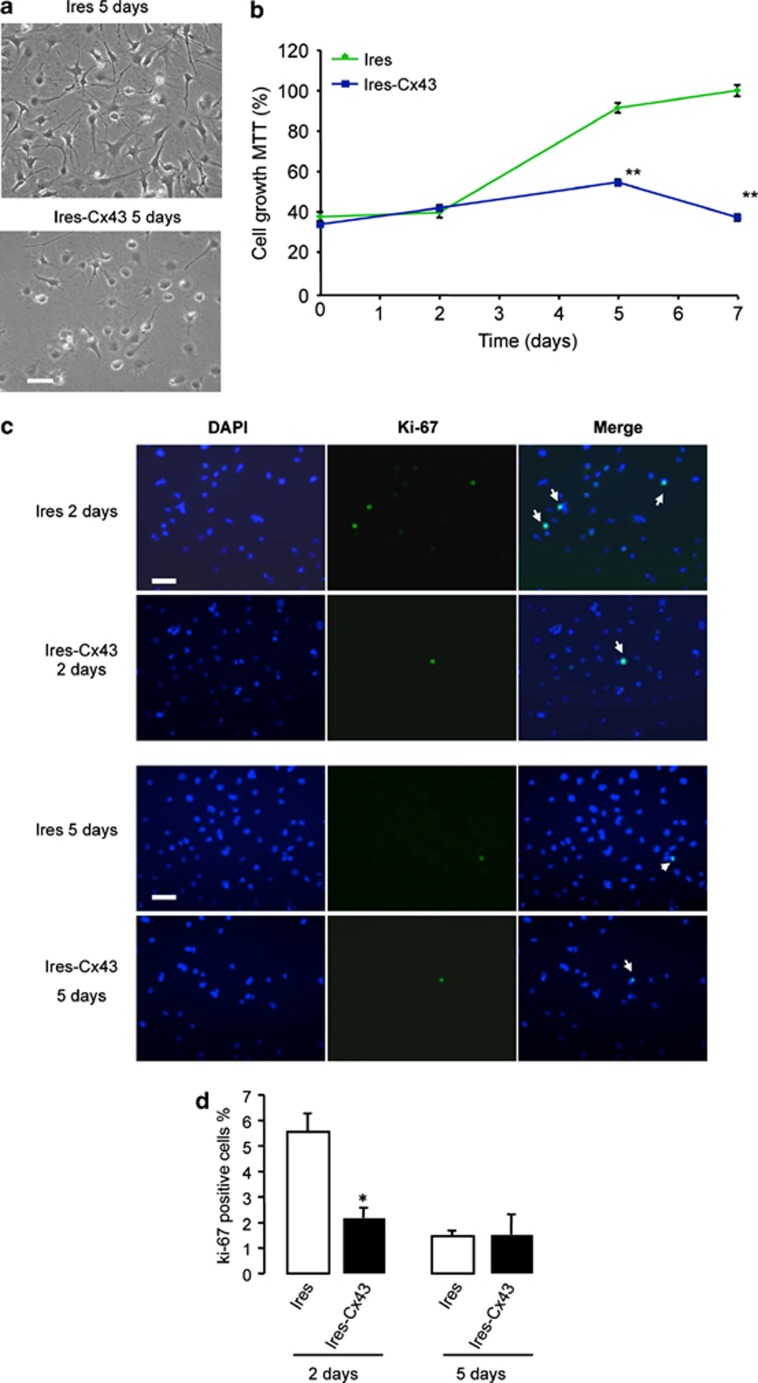
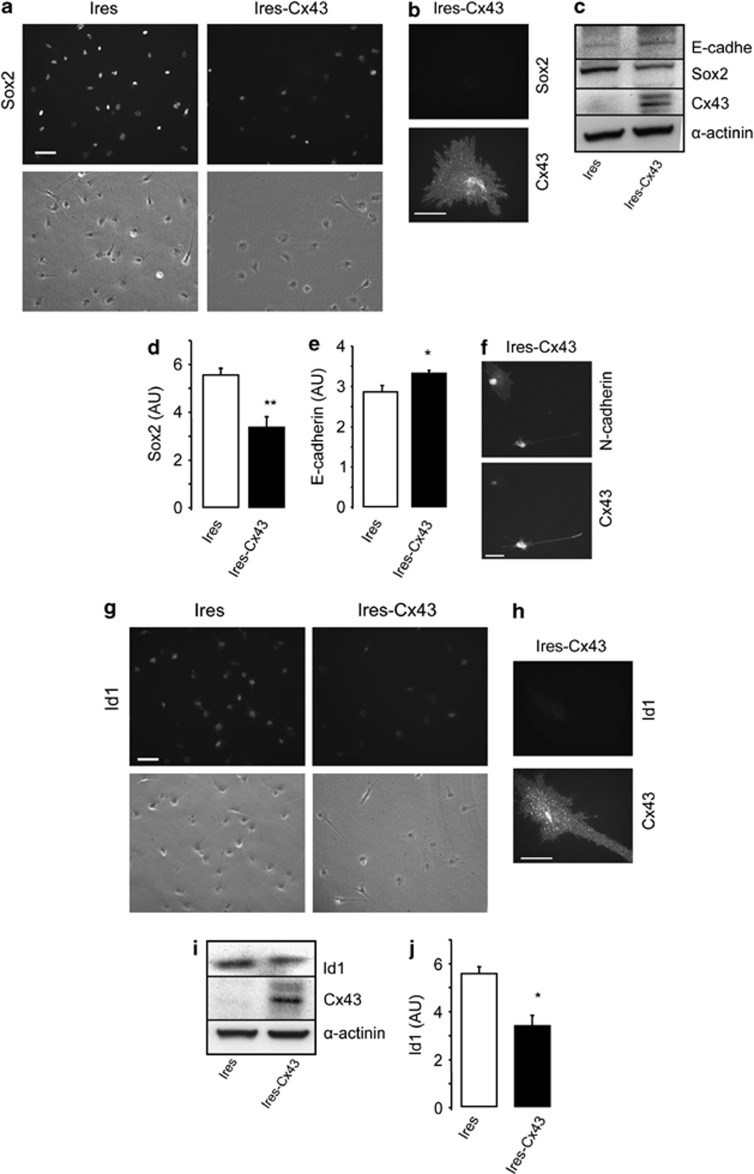
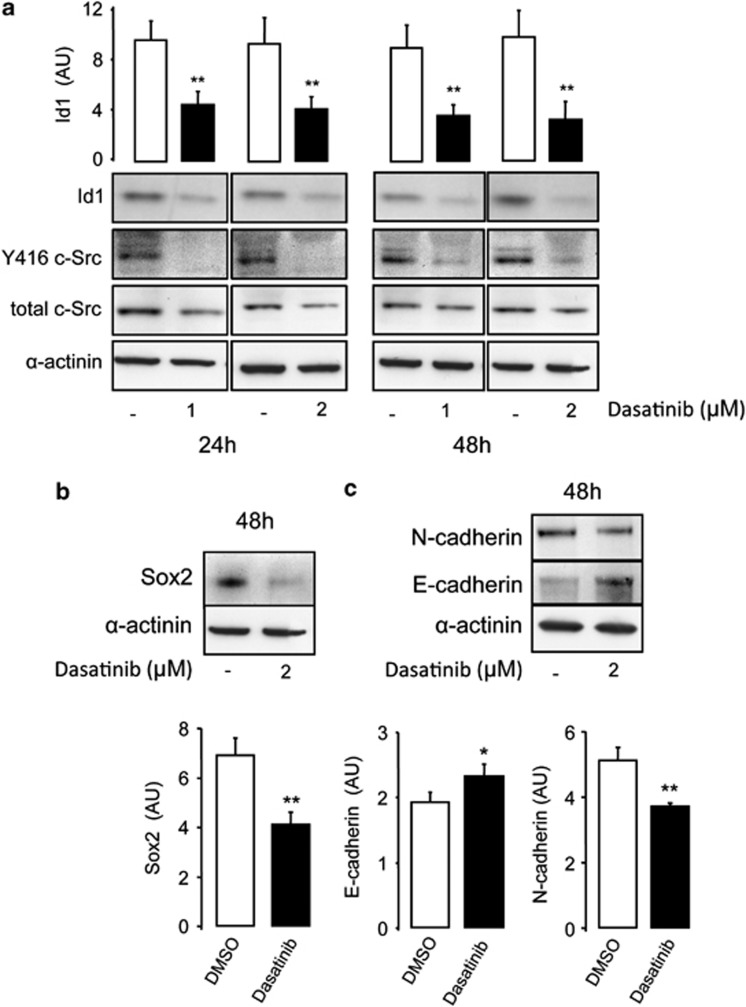
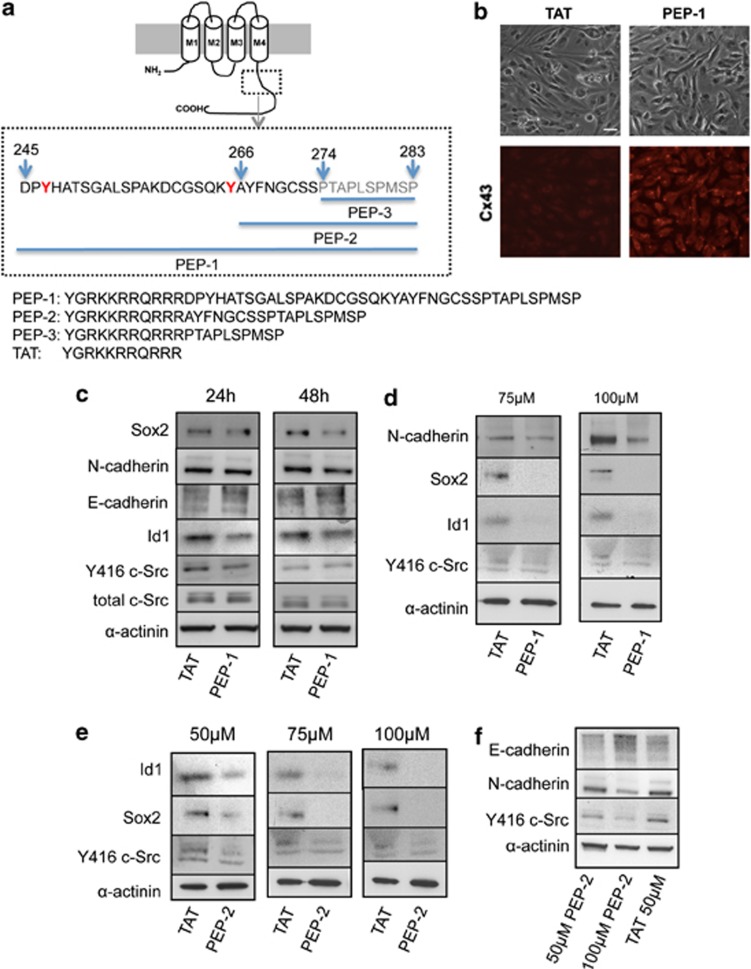
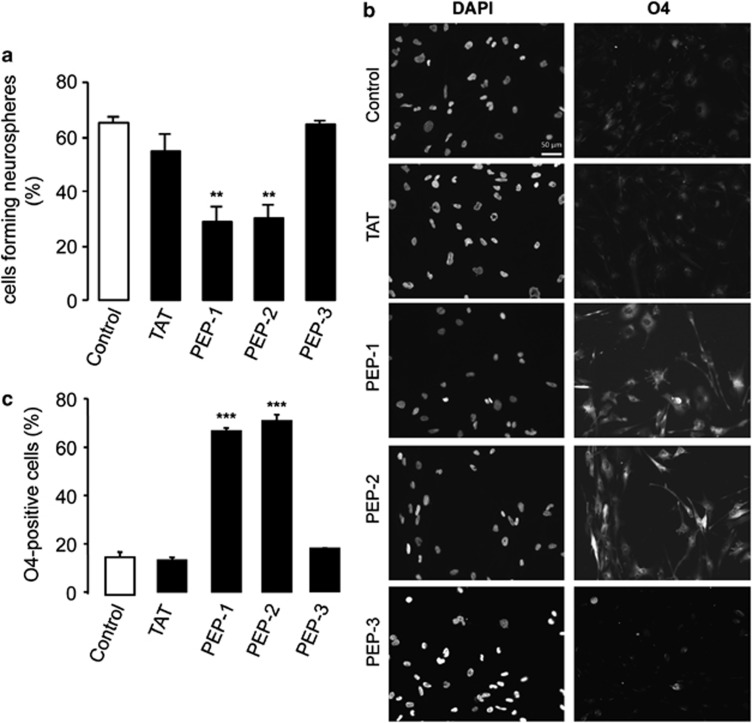
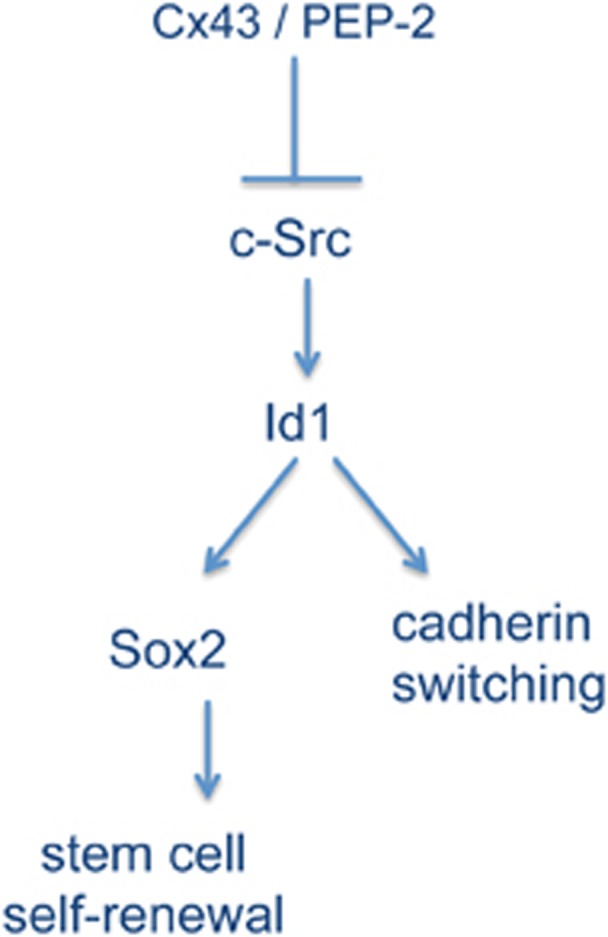
Connexin43 (Cx43), the main gap junction channel-forming protein in astrocytes, is downregulated in malignant gliomas. These tumors are composed of a heterogeneous population of cells that include many with stem-cell-like properties, called glioma stem cells (GSCs), which are highly tumorigenic and lack Cx43 expression. Interestingly, restoring Cx43 reverses GSC phenotype and consequently reduces their tumorigenicity. In this study, we investigated the mechanism by which Cx43 exerts its antitumorigenic effects on GSCs. We have focused on the tyrosine kinase c-Src, which interacts with the intracellular carboxy tail of Cx43. We found that Cx43 regulates c-Src activity and proliferation in human GSCs expanded in adherent culture. Thus, restoring Cx43 in GSCs inhibited c-Src activity, which in turn promoted the downregulation of the inhibitor of differentiation Id1. Id1 sustains stem cell phenotype as it controls the expression of Sox2, responsible for stem cell self-renewal, and promotes cadherin switching, which has been associated to epithelial-mesenchymal transition. Our results show that both the ectopic expression of Cx43 and the inhibition of c-Src reduced Id1, Sox2 expression and promoted the switch from N- to E-cadherin, suggesting that Cx43, by inhibiting c-Src, downregulates Id1 with the subsequent changes in stem cell phenotype. On the basis of this mechanism, we found that a cell-penetrating peptide, containing the region of Cx43 that interacts with c-Src, mimics the effect of Cx43 on GSC phenotype, confirming the relevance of the interaction between Cx43 and c-Src in the regulation of the malignant phenotype and pinpointing this interaction as a promising therapeutic target.


Figures

Figure 1
Figure 1
Cx43 expression and c-Src activity in GSCs. (a) Western blot analysis of Cx43, Y416 c-Src and total c-Src in OB1 and TG10 GSCs. (b) Western blot analysis of Cx43 expressed by G166, GliNS2, G179 and G144 GSCs characterized in Pollard et al. (c) Western blot analysis of Y416 c-Src and total c-Src G166, GliNS2, G179 and G144 cells. Rat C6 glioma cell line and rat astrocytes from primary culture were used as controls
Figure 2
Figure 2
Effect of Cx43 on c-Src activity. (ac) G166 cells were transfected with 50 nM NT-siRNA or Cx43-siRNA. (a) Western blot analysis of Y416 c-Src, total c-Src, Cx43 and GAPDH 2 or 4 days after transfection. (b) Y416 c-Src and (c) total c-Src quantification. ***P<0.001, **P<0.01, *P<0.05 versus the corresponding NT-siRNA. (dg) GliNS2 cells were transfected with the empty vector (Ires) or with the vector containing the Cx43 cDNA (Ires-Cx43). (d) Levels of Y416 c-Src, Cx43 and α-actinin detected by western blot analysis after transfection with increasing plasmid concentrations. (e) Time course of Y416 c-Src, total c-Src, Cx43 and GAPDH after transfecting cells with 1 μg/μl Ires or Ires-Cx43. (f) Y416 c-Src and (g) total c-Src quantification after transfecting cells with 1 μg/μl Ires or Ires-Cx43 for 2 or 5 days. **P<0.01 versus Ires
Figure 3
Figure 3
Effect of silencing Cx43 on G166 cell proliferation. G166 cells were transfected with 50 nM NT-siRNA or Cx43-siRNA. (a) Phase-contrast photomicrographs showing the increase in cell density 4 days after the transfection with Cx43-siRNA. (b) The number of living cells was followed for 6 days by MTT assay. The results are expressed as the percentages of the higher value of absorbance found (Cx43-siRNA, 6th day). **P<0.01 versus the corresponding NT-siRNA. (c) DAPI, Ki-67 and merged photomicrographs of the same field showing Ki-67-positive cells (arrow) after 2 or 4 days. Scale bar=20 μm (d) Percentage of Ki-67-positive cells. ***P<0.001, **P<0.01 versus the corresponding NT-siRNA
Figure 4
Figure 4
Effect of restoring Cx43 on GliNS2 cell proliferation. GliNS2 cells were transfected with 1 μg/μl of the empty vector (Ires) or with the vector containing the Cx43 cDNA (Ires-Cx43). (a) Phase-contrast photomicrographs showing the reduction on cell density 5 days after the transfection with Ires-Cx43. (b) The number of living cells was followed for 7 days by MTT assay. The results are expressed as the percentages of the higher value of absorbance found (Ires, 7th day). **P<0.01 versus the corresponding Ires. (c) DAPI, Ki-67 and merged photomicrographs of the same field showing Ki-67-positive cells (arrow) after 2 or 5 days. Scale bar=20 μm. (d) Percentage of Ki-67-positive cells. *P<0.05 versus the corresponding Ires
Figure 5
Figure 5
Effect of restoring Cx43 on Sox2, E-cadherin, N-cadherin and Id1 expression in GSC. GliNS2 cells were transfected with the empty vector (Ires) or with the vector containing the Cx43 cDNA (Ires-Cx43). (a) Immunostaining and phase contrast from the same field showing the decrease in Sox2 expression in Cx43-transfected GSCs. Scale bar=20 μm. (b) Double immunostaining showing the lack of Sox2 in Cx43-expressing cells. Scale bar=10 μm. (c) Western blot analysis for Cx43, Sox2, E-cadherin and α-actinin as a loading control. (d) Sox2 and (e) E-cadherin quantification. **P<0.01, *P<0.05 versus the corresponding Ires. (f) Double immunostaining showing the downregulation of N-cadherin in Cx43-expressing cells. Scale bar=10 μm. (g) Immunostaining and phase contrast from the same field showing the decrease in Id1 expression in Cx43-transfected GSC. Scale bar=20 μm. (h) Double immunostaining showing the lack of Id1 in Cx43-expressing cells. Scale bar=10 μm. (i) Western blot analysis for Cx43 and Id1. (j) Id1 quantification. *P<0.05 versus the corresponding Ires
Figure 6
Figure 6
Participation of c-Src in the reversion of GSC phenotype. GliNS2 cells were incubated with dasatinib with the indicated concentrations for 24 or 48 h. (a) Western blot analysis and quantification for Id1; western blot analysis for Y416 c-Src and total c-Src showing the inhibition of c-Src activity promoted by dasatinib. (b) Western blot analysis and quantification for Sox2. (c) Western blot analysis and quantification for E-cadherin and N-cadherin. *P<0.05; **P<0.01 versus control
Figure 7
Figure 7
Effect of peptides based on Cx43 on GSC phenotype. (a) Sequence of the cell-penetrating peptides based on c-Src–Cx43 interaction containing the TAT sequence fused at the N terminus. PEP-1: the c-Src binding domain and the tyrosines (in red) phosphorylated by c-Src (245–283); PEP-2: the residues affected by the binding of the Src SH3 domain (266–283) and PEP-3: the consensus SH3 binding site (274–283). (b) GliNS2 cells were incubated with 50 μM TAT or 50 μM PEP-1 for 24 h. Immunostaining of Cx43 and phase contrast from the same field showing the internalization of PEP-1 into GSC. Scale bar=20 μm. (c) GliNS2 cells were incubated with 50 μM TAT or 50 μM PEP-1 for 24 or 48 h. Western blot analysis for total c-Src, Y416 c-Src, Id1, E-cadherin, N-cadherin and Sox2. (d) GliNS2 cells were incubated with TAT or PEP-1 at different concentrations (75 or 100 μM) for 24 h. Western blot analysis for Y416 c-Src, Id1, Sox2 and N-cadherin. (e) GliNS2 cells were incubated with TAT or PEP-2 at different concentrations (50, 75 or 100 μM) for 24 h. Western blot analysis for Y416 c-Src, Id1 and Sox2. (f) GliNS2 cells were incubated with TAT 50 μM or PEP-2 (50 or 100 μM) for 24 h. Western blot analysis for Y416 c-Src, E-cadherin and N-cadherin
Figure 8
Figure 8
Effect of peptides based on Cx43 on GSC clonogenicity and differentiation. (a) GliNS2 cells were seeded at a density of 1 or 2 cells per well into 96-well plates and incubated with 50 μM TAT, PEP-1, PEP-2 or PEP-3. After 4 weeks, the percentage of cells forming neurospheres was determined. **P<0.01 versus the control. (b) GliNS2 cells were incubated with 25 μM TAT, PEP-1, PEP-2 or PEP-3 for 96 h. DAPI and O4 immunostaining of the same field showing O4-positive cells after PEP-1 or PEP-2 treatment. Scale bar=50 μm. (c) Percentage of O4-positive cells. ***P<0.001 versus control
Figure 9
Figure 9
Proposed mechanism. Our results show that restoration of Cx43 or the sequence of Cx43 that contains the c-Src-binding domain inhibits c-Src activity in GSC, which in turn downregulates the expression of the inhibitor of differentiation Id1. As Id1 regulates Sox2 expression and cadherin switching, it could be proposed that this regulator of transcription is mediating the effect of Cx43 on Sox2 expression and cadherin switching. Downregulation of Sox2 reduces GSC self-renewal and cadherin switching. Consequently, we propose that Cx43 triggers this pathway to reverse GSC phenotype and consequently tumorigenicity

Similar articles

Cited by

References

    1. Giaume C, Koulakoff A, Roux L, Holcman D, Rouach N. Astroglial networks: a step further in neuroglial and gliovascular interactions. Nat Rev Neurosci. 2010;11:87–99. - PubMed
    1. Rouach N, Koulakoff A, Abudara V, Willecke K, Giaume C. Astroglial metabolic networks sustain hippocampal synaptic transmission. Science. 2008;322:1551–1555. - PubMed
    1. Bennett MV, Contreras JE, Bukauskas FF, Saez JC. New roles for astrocytes: gap junction hemichannels have something to communicate. Trends Neurosci. 2003;26:610–617. - PMC - PubMed
    1. Loewenstein WR, Kanno Y. Intercellular communication and the control of tissue growth: lack of communication between cancer cells. Nature. 1966;209:1248–1249. - PubMed
    1. Naus CC, Laird DW. Implications and challenges of connexin connections to cancer. Nat Rev Cancer. 2010;10:435–441. - PubMed

Publication types

MeSH terms