. 2014 Mar;306(6):G515-25.
doi: 10.1152/ajpgi.00364.2013. Epub 2014 Jan 23.

Glial cell line-derived neurotrophic factor protects against high-fat diet-induced obesity

Affiliations

Glial cell line-derived neurotrophic factor protects against high-fat diet-induced obesity

Simon Musyoka Mwangi et al. Am J Physiol Gastrointest Liver Physiol. 2014 Mar.

Abstract

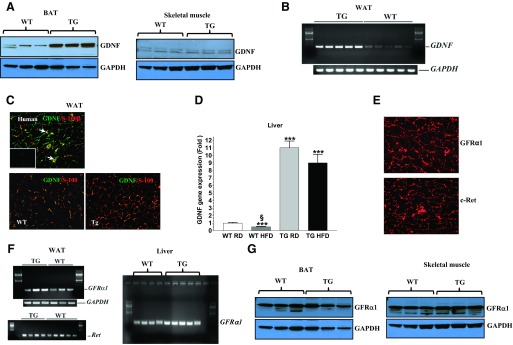
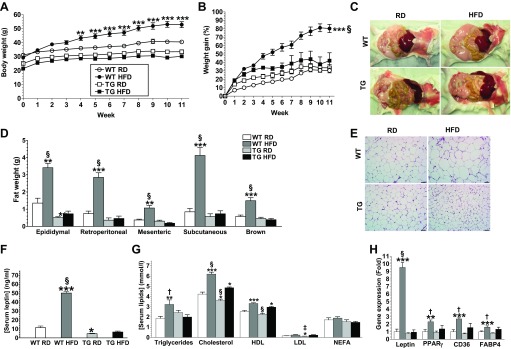
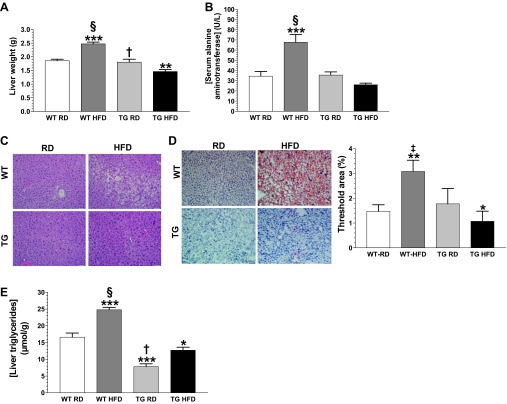
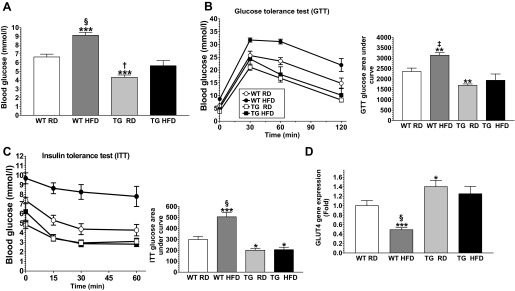
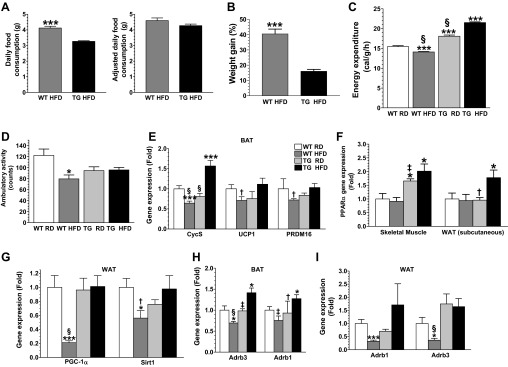
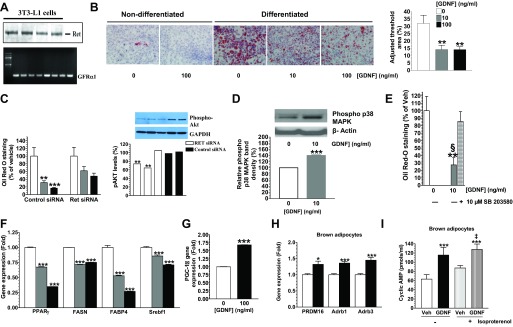
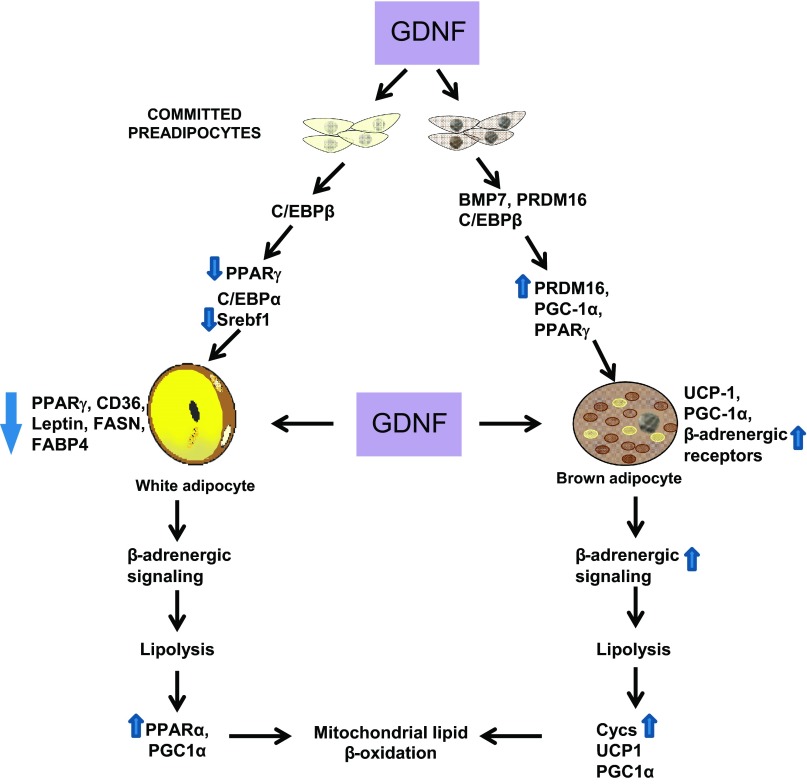
Obesity is a growing epidemic with limited effective treatments. The neurotrophic factor glial cell line-derived neurotrophic factor (GDNF) was recently shown to enhance β-cell mass and improve glucose control in rodents. Its role in obesity is, however, not well characterized. In this study, we investigated the ability of GDNF to protect against high-fat diet (HFD)-induced obesity. GDNF transgenic (Tg) mice that overexpress GDNF under the control of the glial fibrillary acidic protein promoter and wild-type (WT) littermates were maintained on a HFD or regular rodent diet for 11 wk, and weight gain, energy expenditure, and insulin sensitivity were monitored. Differentiated mouse brown adipocytes and 3T3-L1 white adipocytes were used to study the effects of GDNF in vitro. Tg mice resisted the HFD-induced weight gain, insulin resistance, dyslipidemia, hyperleptinemia, and hepatic steatosis seen in WT mice despite similar food intake and activity levels. They exhibited significantly (P<0.001) higher energy expenditure than WT mice and increased expression in skeletal muscle and brown adipose tissue of peroxisome proliferator activated receptor-α and β1- and β3-adrenergic receptor genes, which are associated with increased lipolysis and enhanced lipid β-oxidation. In vitro, GDNF enhanced β-adrenergic-mediated cAMP release in brown adipocytes and suppressed lipid accumulation in differentiated 3T3L-1 cells through a p38MAPK signaling pathway. Our studies demonstrate a novel role for GDNF in the regulation of high-fat diet-induced obesity through increased energy expenditure. They show that GDNF and its receptor agonists may be potential targets for the treatment or prevention of obesity.

Keywords: beta-oxidation; energy expenditure; hepatic steatosis; neurotrophic; β-adrenergic signaling.


Figures

Fig. 1.
Fig. 1.
Analyses of tissue expression of glial cell line-derived neurotrophic factor (GDNF), and GFRα1 and Ret receptors. A: Western blot analyses of GDNF levels in brown adipose tissue (BAT) and skeletal muscle from wild-type (WT) and GDNF transgenic mice (Tg) mice. B: analysis by RT-PCR of GDNF gene expression in white adipose tissue (WAT) from WT and Tg mice. C: immunofluorescence staining for GDNF (green) and the glial cell marker S-100β (red) in human WAT (top) and WAT from WT and Tg mice (bottom). Arrows depict GDNF-expressing glial cells. Inset (top) shows negative control. Scale bar, 50 μm. D: real-time PCR comparison of GDNF gene expression in liver from WT and Tg mice. Plotted are means + SE. ***P < 0.001, relative to WT mice maintained on the regular diet (RD). §P < 0.001, relative to Tg mice maintained on the high-fat diet (HFD); n = 5–7 mice per group. E: immunofluorescence staining for Ret (c-Ret) and GFRα1 receptors in human WAT. Scale bar, 50 μm. F: RT-PCR analyses of GFRα1 and Ret receptor gene expression in the WAT and GFRα1 receptor gene expression in liver from WT and Tg mice. G: Western blot analyses of GFRα1 receptor expression in the BAT and skeletal muscle from WT and Tg mice.
Fig. 2.
Fig. 2.
GDNF Tg mice are protected against high-fat diet-induced obesity. Body weight (A) and weight gain curves (B) for WT and Tg mice maintained on a RD or HFD for 11 wk. Representative images showing intra-abdominal fat deposits (C), adipose tissue weights (D), and hematoxylin and eosin-stained retroperitoneal WAT (E) from WT and Tg mice. Scale bar, 50 μm. F: serum leptin levels. G: serum triglycerides, cholesterol, HDL, LDL, and nonesterified fatty acids (NEFA) levels. H: real-time PCR analyses of expression of lipogenic genes in WAT from WT and Tg mice maintained on a RD or HFD. Plotted are means + SE. *P < 0.5; **P < 0.01; ***P < 0.001, relative to WT mice maintained on the RD. †P < 0.05; ‡P < 0.01; §P < 0.001, relative to Tg mice maintained on the HFD; n = 5–7 mice per group.
Fig. 3.
Fig. 3.
GDNF Tg mice are protected against high-fat diet-induced hepatic steatosis. Liver weights (A) and serum alanine aminotransferase (ALT) levels (B) for WT and Tg mice maintained on the RD or HFD diet for 11 wk. Representative images of liver sections stained with hematoxylin and eosin (C) and Oil Red O (D). E: liver triglyceride levels. Scale bar, 50 μm. Plotted are means + SE. *P < 0.5; **P < 0.01; ***P < 0.001, relative to WT mice maintained on the RD. †P < 0.05; ‡P < 0.01; §P < 0.001, relative to Tg mice maintained on the HFD; n = 5–7 mice per group.
Fig. 4.
Fig. 4.
GDNF Tg mice resist high-fat diet-induced glucose intolerance and insulin resistance. Fasting blood glucose (A), glucose tolerance test (GTT) and GTT glucose area under the curve (B), and insulin tolerance test (ITT) and ITT glucose area under the curve (C) for WT and Tg mice maintained on the RD or HFD for 10 wk. D: analysis of GLUT4 gene expression in WAT from WT and Tg mice maintained on the RD or HFD diet for 11 wk. Plotted are means + SE. *P < 0.5; **P < 0.01; ***P < 0.001, relative to WT mice maintained on the RD. †P < 0.05; ‡P < 0.01; §P < 0.001, relative to Tg mice maintained on the HFD; n = 5–7 mice per group.
Fig. 5.
Fig. 5.
GDNF Tg mice have enhanced energy expenditure. A: daily food consumption and food consumption adjusted to body weight for Tg and WT mice fed the HFD ad libitum. B: plot of weight gains for Tg and WT mice pair-fed a HFD for 4 wk. C and D: energy expenditure (C) and ambulatory activity (D) for WT and Tg mice maintained on the RD or HFD for 10 wk. Analysis by real-time PCR of gene expression in BAT (E), skeletal muscle and WAT (F), and WAT (G) from Tg and WT mice maintained on the RD or HFD for 11 wk. Analyses of β1 (Adrb1)- and β3 (Adrb3)-adrenergic receptor gene expression in BAT (H) and epididymal WAT (I) from Tg and WT mice maintained on the RD or HFD for 11 wk. Plotted are means + SE. *P < 0.5; ***P < 0.001, relative to WT mice maintained on the RD. †P < 0.05; ‡P < 0.01; §P < 0.001, relative to Tg mice maintained on the HFD; n = 5–7 mice per group.
Fig. 6.
Fig. 6.
GDNF suppresses the accumulation of triglycerides in adipocytes in vitro. A: analysis of Ret receptor protein and GFRα1 receptor gene expression in 3T3-L1 adipocytes. B: Oil Red O-stained 3T3-L1 cells and densitometric analysis of staining intensity. Scale bar, 50 μm. C: analysis of effect of knockdown of the Ret receptor on triglyceride accumulation and Akt phosphorylation in differentiated 3T3-L1 cells. D: Western blot analysis of P38 MAPK phosphorylation in differentiated 3T3-L1 cells stimulated with GDNF. E: effects of the p38 MAPK inhibitor SB 203580 on GDNF-mediated suppression of triglyceride accumulation in differentiated 3T3-L1 cells. F: analyses of PPARγ, FASN, Srebf1 and FABP4 gene expression in differentiated 3T3-L1 cells cultured in the presence or absence of GDNF. G: analysis of PGC-1α gene expression in 3T3-L1 adipocytes differentiated in the presence or absence of GDNF. Plotted are means + SE. **P < 0.01, ***P < 0.001, relative to vehicle (Veh). §P < 0.001, relative to GDNF + SB 203580. H: PRDM16, Adrb1, and Adrb3 gene expression in differentiated brown adipocytes after 24-h culture in the presence or absence of GDNF. I: analysis of cyclic AMP release in differentiated brown adipocytes cultured in medium supplemented with or without GDNF and stimulated with isoproterenol. Plotted are means + SE. *P < 0.5; ***P < 0.001, relative to vehicle. ‡P < 0.01, relative to vehicle + isoproterenol.
Fig. 7.
Fig. 7.
Potential mechanism of GDNF regulation of adiposity. White and brown adipocytes originate from different precursors. Differentiation of precursors committed to the white lineage is driven by a cascade of interactions involving several proteins including those encoded by the CCAAT/enhancer-binding proteins β (C/EBPβ), peroxisome proliferator-activated receptor-γ (PPARγ), C/EBPα, and sterol regulatory element binding transcription factor 1 (Srebf1) genes. Differentiation of committed brown preadipocytes on the other hand involves interactions between proteins encoded by the bone morphogenetic protein 7 (BMP7), PR domain-containing 16 (PRDM16), PPARγ, and C/EBPβ. Increased GDNF levels during white preadipocyte differentiation suppresses the expression of factors including PPARγ, fatty acid translocase (CD36), fatty acid synthase (FASN), and fatty acid binding protein 4 (FABP4), resulting in inhibition of adipose tissue expansion and lipid accumulation. Increased GDNF levels during brown preadipocyte differentiation on the other hand increase PRDM16 and β1- and β2-adrenergic receptor gene expression, which enhances brown adipose tissue formation. Enhanced GDNF expression during high-fat diet feeding induces increased β-adrenergic signaling in both white and brown adipose tissue, resulting in increased lipolysis and lipid β-oxidation. Arrows on the side of each gene pointing upward and downward indicate genes whose expression we have observed to be, respectively, increased or reduced.

References

    1. Abel ED, Peroni O, Kim JK, Kim YB, Boss O, Hadro E, Minnemann T, Shulman GI, Kahn BB. Adipose-selective targeting of the GLUT4 gene impairs insulin action in muscle and liver. Nature 409: 729–733, 2001 - PubMed
    1. Airaksinen MS, Saarma M. The GDNF family: signalling, biological functions and therapeutic value. Nat Rev Neurosci 3: 383–394, 2002 - PubMed
    1. Aitman TJ, Glazier AM, Wallace CA, Cooper LD, Norsworthy PJ, Wahid FN, Al-Majali KM, Trembling PM, Mann CJ, Shoulders CC, Graf D, St Lezin E, Kurtz TW, Kren V, Pravenec M, Ibrahimi A, Abumrad NA, Stanton LW, Scott J. Identification of Cd36 (Fat) as an insulin-resistance gene causing defective fatty acid and glucose metabolism in hypertensive rats. Nat Genet 21: 76–83, 1999 - PubMed
    1. Bachman ES, Dhillon H, Zhang CY, Cinti S, Bianco AC, Kobilka BK, Lowell BB. βAR signaling required for diet-induced thermogenesis and obesity resistance. Science 297: 843–845, 2002 - PubMed
    1. Bronnikov G, Bengtsson T, Kramarova L, Golozoubova V, Cannon B, Nedergaard J. β1 to β3 switch in control of cyclic adenosine monophosphate during brown adipocyte development explains distinct beta-adrenoceptor subtype mediation of proliferation and differentiation. Endocrinology 140: 4185–4197, 1999 - PubMed

Publication types

Substances