. 2014 Apr;8(3-4):130-42.
doi: 10.1002/prca.201300031. Epub 2014 Mar 7.

Aberrant glycosylation in the human trabecular meshwork

Affiliations

Aberrant glycosylation in the human trabecular meshwork

Adam E Sienkiewicz et al. Proteomics Clin Appl. 2014 Apr.

Abstract

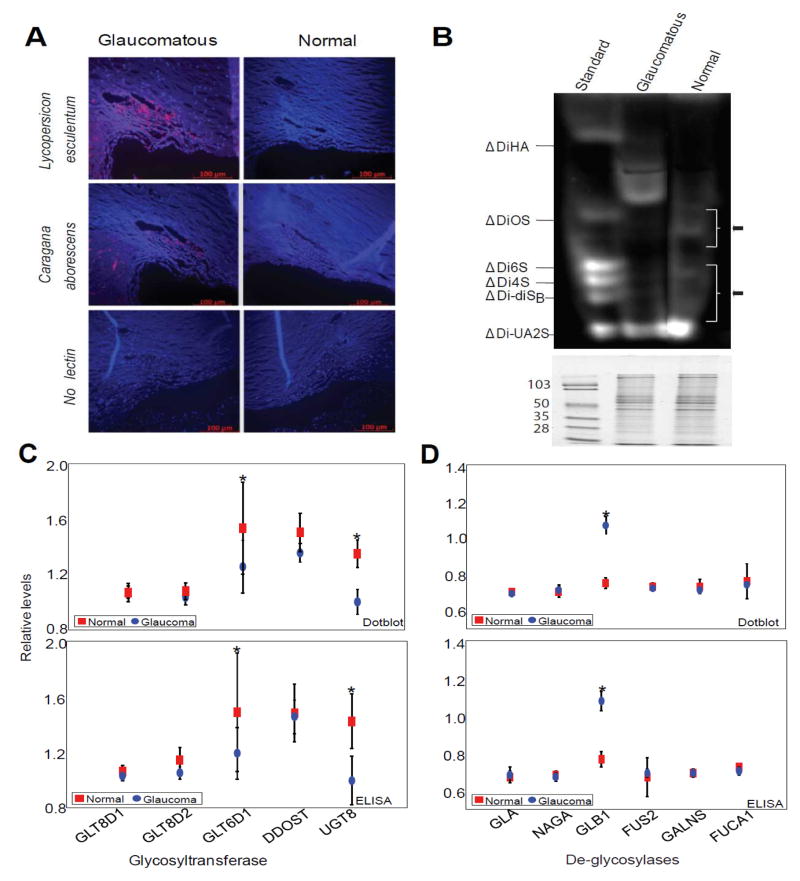
Purpose: To determine the difference in protein glycosylation and glycosylation enzyme levels between glaucomatous and control trabecular meshwork (TM).

Experimental design: Glaucomatous and normal donor (n = 12 each) TM tissues, lectin fluorescence, fluorophore-assisted carbohydrate analyses, and quantitative MS were used to determine the glycosylation levels. Primary TM cells and glycosylation inhibitors were used to determine their effect on cell shape and motility.

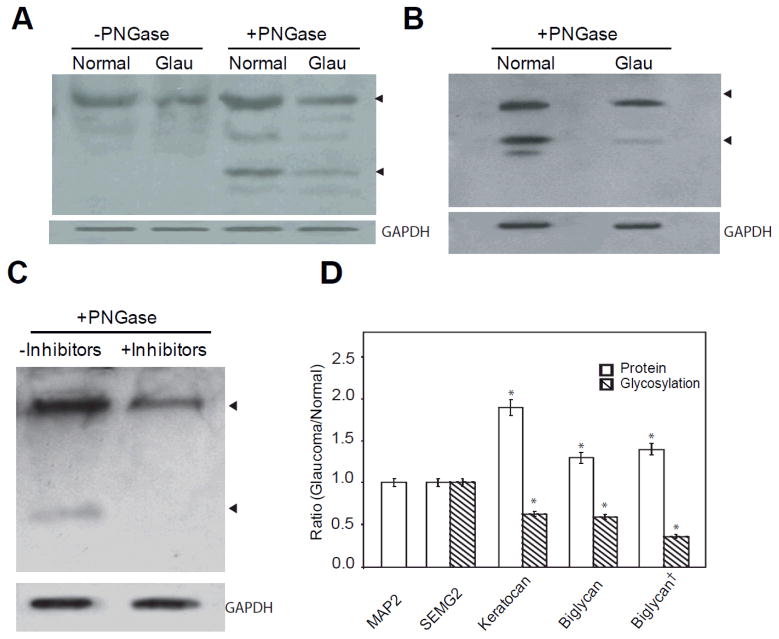
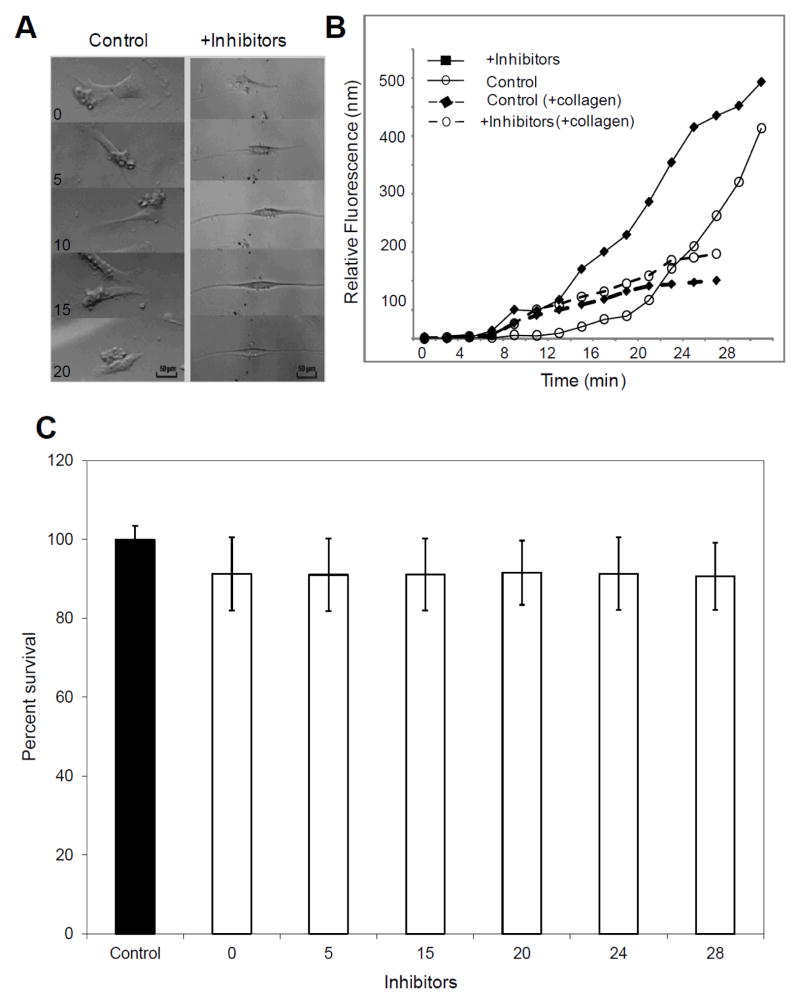
Results: In contrast to elevated levels of glycoproteins determined by lectin fluorescence, simultaneous hyper- and hypo-glycosylation in glaucomatous TM was revealed by fluorophore-assisted carbohydrate analyses. Analyses of enzymes showed elevation of beta-glycosidase 1 and decrease in galactosyltransferase family 6 domain containing protein 1 in the glaucomatous TM. Quantitative MS identified select protein level changes between glaucomatous and normal TM. Primary TM cells were treated with inhibitors to elicit hypo-glycosylation, which affected cell shape, motility, and fluorescent tracer transport across a layer of TM cells.

Conclusions and clinical relevance: Global protein glycosylation is aberrant in glaucomatous TM compared to controls. The results presented here suggest that the alteration in global TM protein glycosylation encompassing cellular and extracellular matrix proteins contributes to glaucoma pathology likely mediated through changes in properties of TM cells.

Keywords: Carbohydrate electrophoresis; Glaucoma; Glycosylation; Trabecular meshwork.


Figures

Figure 1
Figure 1
Glycosylation levels and protein glycosylation enzymatic activities in control and glaucomatous trabecular meshwork (TM). (A) Representative microscopic image of histochemical analyses (n=12 each glaucoma and control) of bound fluorescent-lectins in the TM. The cadaver TM from glaucomatous or control donors as indicated was probed using biotinylated lectins as indicated. The detection was based on Alexa®-594 coupled streptavidin binding to biotinylated lectin. Images were taken on Leica TSP5 confocal microscope (Leica Corporation, Manheim, Germany) at 20x magnification. A tissue section that was not probed with any lectin served as negative control. (B) Representative Fluorophore-assisted carbohydrate electrophoresis (FACE®) analyses of 2-aminoacridone (AMAC) derivatized testicular hyaluronidase and chondroitinase ABC digested products from normal and glaucomatous TM as indicated. The disaccharide standards were obtained from Hyal-Dermato Disaccharide D-kit (cat# 400572-1; Seikagaku Corporation) To indicate equal loading, an identical aliquot was loaded on to a 10% SDS-PAGE and stained with Coomassie blue for protein staining with molecular markers as indicated presented in the bottom panel. (C) Relative quantification of glycosyltransferase immunoreactivities using ELISA and dotblot densitometric analyses as indicated. (D) Relative quantification of deglycosylase immunoreactivities using ELISA and dot blot densitometric analyses as indicated. The enzymatic immunoreactivity ratio (normalized to total protein/total of GAPDH) of indicated enzymes (C, D) with GAPDH was quantified using ELISA and dot blot analysis as indicated and as described in experimental procedures (n= 12 samples each for glaucoma and control). Results are mean ± standard deviation (*Significantly different results when compared between control and glaucoma donors by the two-tailed two sample t-test: *p<0.05). Control and glaucomatous samples are represented by red squares and blue circles for dot blots and ELISA analyses as indicated.
Figure 2
Figure 2
Glycosylation differences of select target proteins in glaucomatous TM compared to controls (n= 12 each) and in response to glycosylation inhibitors. (A) Representative Western analyses of Keratocan in control and glaucomatous TM protein extracts (10μg) with or without PNGase F treatment as indicated. The ratio of intact to collapsed protein band on digestion provided the ratio of glycosylation for normal or glaucoma. The ratio of intact band between glaucoma to normal provided the level of protein (normalized to total protein, GAPDH or Beta-actin). (B) Representative Western analyses of Biglycan in control and glaucomatous TM protein extracts with PNGase F treatment. (C) Representative Western analyses of Biglycan in control and inhibitor treated (SS: 150μM, PhQ: 75 μM, MeQ: 50 μM) cell extracts subjected to PNGase F treatment. Glycerol 3-phosphate dehydrogenase (GAPDH) immunoreactivity as indicator of loading control for panels A through C have been presented as indicated. (D) Densitometric estimation of proteins (hollow bars) and glycosylation (hashed bars) expressed as ratio for each specific protein as indicated. The ratios for proteins and glycosylation are immunoreactivity in glaucoma/normal, except for Biglycan†, which indicates ratio of inhibitor treated/untreated control. The glycosylation level in normal or glaucoma was the normalized ratio of glycosylation estimated by partial digestion of PNGase treatment compared to undigested control band (as shown for Keratocan in A). The overall ratio of glycosylation estimated in glaucoma to control (for Biglycan†, inhibitor treated to control) using this procedure has been depicted with hashed bars. The results are mean± SD of three independent experiments. The mean ratio was subjected to a two-tailed paired t-test; *P ≤0.05.
Figure 3
Figure 3
Effects of inhibitor mediated reduction in glycosylation in vitro (representative data). (A) Representative microscopic images depicting cell morphology in response to inhibitor mediated reduction in protein glycosylation in comparison to controls as indicated in selected hourly time intervals (B) The transport of fluorophore across multilayered ensemble of primary TM cells with or without glycosylation inhibitor treatment on a porous 8 μm membrane, without any collagen embedding (solid lines) and with collagen matrix embedding at each cell layer (dashed lines). (C) The cell survival for primary TM cells were determined for control (filled bars) and inhibitor treated groups at indicated time interval (hollow bars) in hours using Trypan blue exclusion assay. The average± standard deviation of percent of cell survival for indicated groups have been shown.

Similar articles

Cited by

References

    1. Stadtman ER. Protein modification in aging. J Gerontol. 1988;43:B112–B20. - PubMed
    1. Bhattacharya SK. Retinal deimination in aging and disease. IUBMB Life. 2009;61:504–9. - PubMed
    1. Jaisson S, Gillery P. Evaluation of nonenzymatic posttranslational modification-derived products as biomarkers of molecular aging of proteins. Clin Chem. 2010;56:1401–12. - PubMed
    1. Quigley HA, Broman AT. The number of people with glaucoma worldwide in 2010 and 2020. Br J Ophthalmol. 2006;90:262–7. - PMC - PubMed
    1. Morrison JC, Johnson EC, Cepurna W, Jia L. Understanding mechanisms of pressure-induced optic nerve damage. Prog Retin Eye Res. 2005;24:217–40. - PubMed

Publication types

MeSH terms