

The most informative spacing test effectively discovers biologically relevant outliers or multiple modes in expression
- PMID: 24458951
- PMCID: PMC4068004
- DOI: 10.1093/bioinformatics/btu039
The most informative spacing test effectively discovers biologically relevant outliers or multiple modes in expression
Abstract
Summary: Several outlier and subgroup identification statistics (OASIS) have been proposed to discover transcriptomic features with outliers or multiple modes in expression that are indicative of distinct biological processes or subgroups. Here, we borrow ideas from the OASIS methods in the bioinformatics and statistics literature to develop the 'most informative spacing test' (MIST) for unsupervised detection of such transcriptomic features. In an example application involving 14 cases of pediatric acute megakaryoblastic leukemia, MIST more robustly identified features that perfectly discriminate subjects according to gender or the presence of a prognostically relevant fusion-gene than did seven other OASIS methods in the analysis of RNA-seq exon expression, RNA-seq exon junction expression and micorarray exon expression data. MIST was also effective at identifying features related to gender or molecular subtype in an example application involving 157 adult cases of acute myeloid leukemia.
Availability: MIST will be freely available in the OASIS R package at http://www.stjuderesearch.org/site/depts/biostats
Contact: stanley.pounds@stjude.org
Supplementary information: Supplementary data are available at Bioinformatics online.
Figures
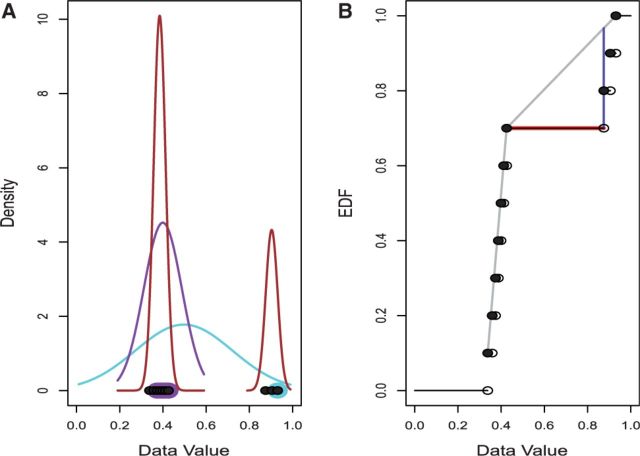
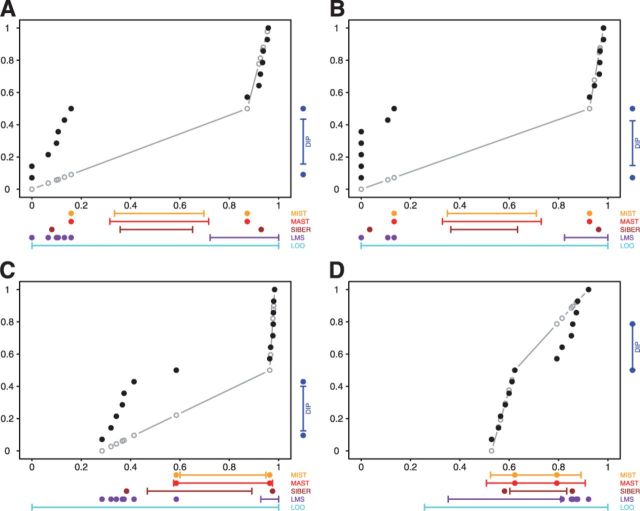
 so that significance at the
  level is indicated by the dots falling beyond the endpoints of the bar. The results of MIST, MAST, SIBER, LMS and LOO are shown in the bottom margin. For each of these methods, the length of the bar indicates the distance between the two points that defines significance at the
  level. For MIST and MAST the two points correspond to the data values that define the spacing of interest. For SIBER, the points correspond to the estimated means of the two-component mixture model. The results of LMS and LOO are shown by 99% intervals and points falling outside those intervals were identified as outliers
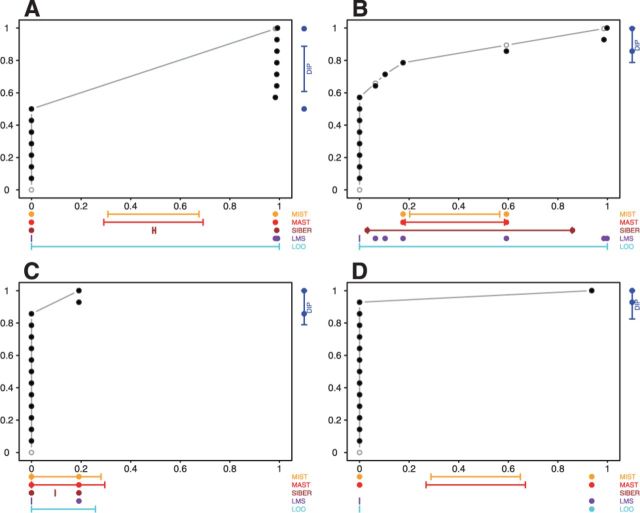
References
-
- Allison DB, et al. Microarray data analysis: from disarray to consolidation and consensus. Nat. Rev. Genet. 2006;7:55–65. - PubMed
-
- Andrews DF, et al. Robust Estimates of Location: Survey and Advances. Princeton University Press: Princeton, NJ; 1972.
-
- Banfield JD, Raftery AE. Model-based gaussian and non-gaussian clustering. Biometrics. 1993;49:803–821.
-
- Benjamini Y, Hochberg Y. Controlling the false discovery rate: a practical and powerful approach to multiple testing. J. R. Stat. Soc., Series B. 1995;57:289–300.
-
- Casella G, Berger R. Statistical Inference. Duxbury Thomson Learning; Australia-Canada-Mexico-Singapore-Spain-United Kingdom-United States; 2001.
Publication types
MeSH terms
Grants and funding
LinkOut - more resources
Full Text Sources
Other Literature Sources
Molecular Biology Databases
