

Chromosome positioning from activity-based segregation
- PMID: 24459132
- PMCID: PMC3985638
- DOI: 10.1093/nar/gkt1417
Chromosome positioning from activity-based segregation
Abstract
Chromosomes within eukaryotic cell nuclei at interphase are not positioned at random, since gene-rich chromosomes are predominantly found towards the interior of the cell nucleus across a number of cell types. The physical mechanisms that could drive and maintain the spatial segregation of chromosomes based on gene density are unknown. Here, we identify a mechanism for such segregation, showing that the territorial organization of chromosomes, another central feature of nuclear organization, emerges naturally from our model. Our computer simulations indicate that gene density-dependent radial segregation of chromosomes arises as a robust consequence of differences in non-equilibrium activity across chromosomes. Arguing that such differences originate in the inhomogeneous distribution of ATP-dependent chromatin remodeling and transcription machinery on each chromosome, we show that a variety of non-random positional distributions emerge through the interplay of such activity, nuclear shape and specific interactions of chromosomes with the nuclear envelope. Results from our model are in reasonable agreement with experimental data and we make a number of predictions that can be tested in experiments.
Figures
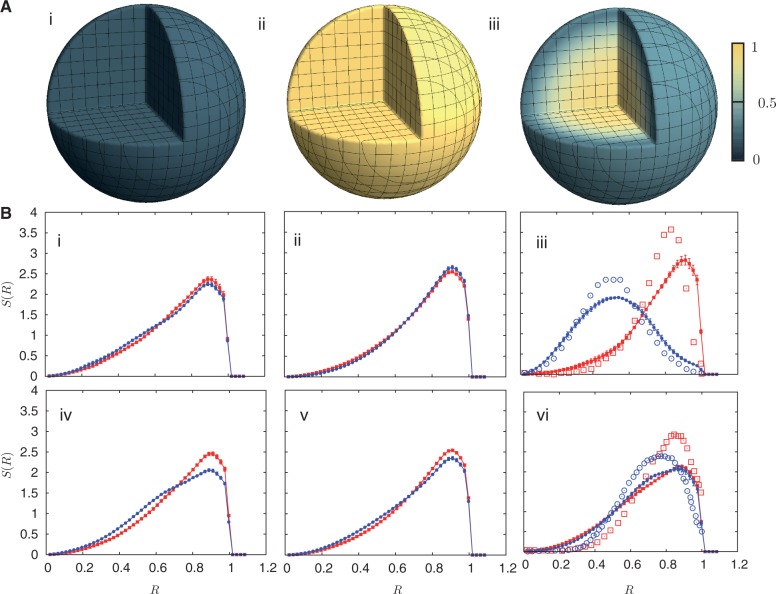
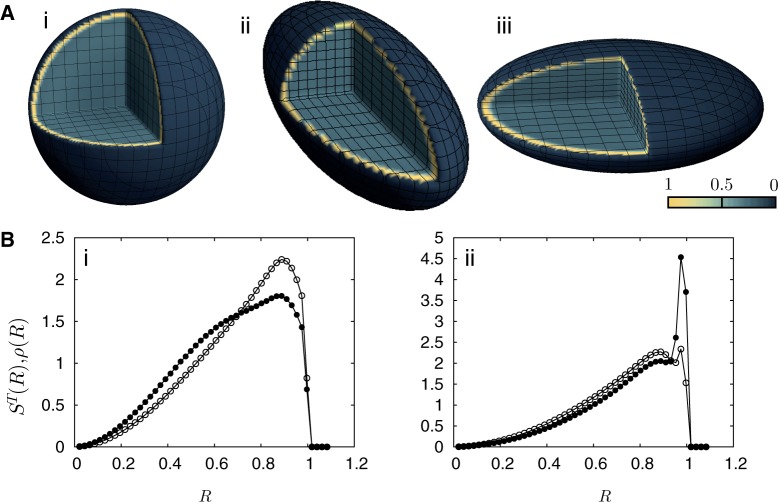
 . The darkest shades represent Teq, whereas the lightest shades represent Ta. (A) (i) represents the thermal equilibrium case, whereas (A) (ii) represents the case where all monomers are assigned a uniform high activity. (A) (iii) shows the case for non-uniform activity. Note that the distribution of activity is unstructured in cases (i) and (ii), being uniformly low in the first case and uniformly high in the second, while it is structured in case (iii), with activity enhanced towards the center. While the data in (i)–(iii) are averaged over all chromosomes, data for the chromosome pairs 18 (red-filled squares) and 19 [blue-filled circles; (B) (i)–(iii)] as well as for 12 (red-filled symbols) and 20 (blue-filled symbols) [B (iv)–(vi)], are shown corresponding to the activity distributions above them. Note that for the uniform activity case, these chromosome pairs are distributed uniformly, with S(R) quadratically increasing toward the nuclear periphery. (B) (iii) and (vi) show these distributions in the case where activity is non-uniform, illustrating that these distributions are non-trivially structured, being enhanced toward the nuclear interior in the case of the more active chromosome. Along with the simulation data in (B) (iii) and (vi) (filled symbols), we also show open symbols in the same chromosome-specific color representing the experimental data displayed in another study (45) for these chromosomes. Error bars indicated refer to standard deviations.
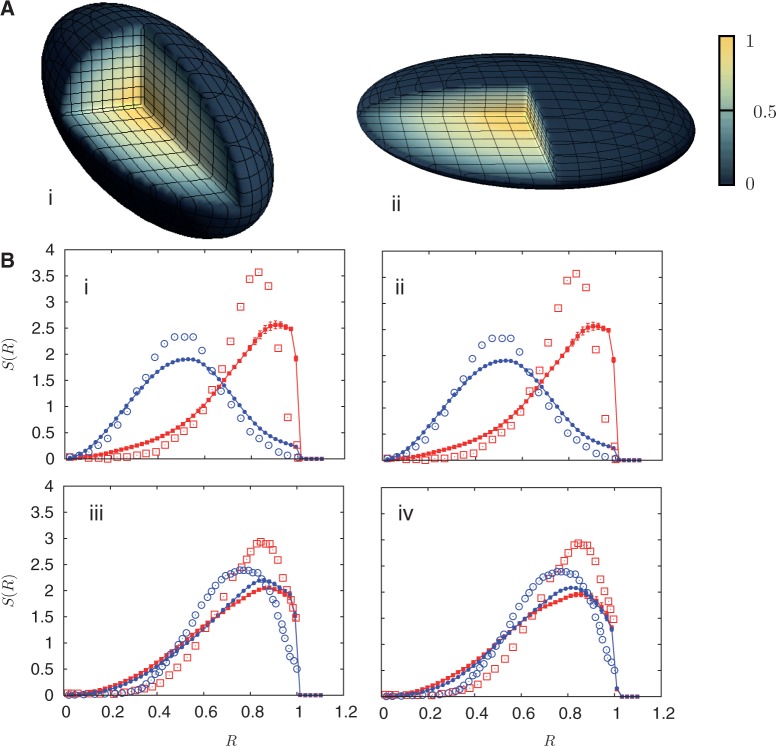
 : open circles] and the gene density [
 : filled circles] for the case of inhomogeneous activity but with a passive interaction with the nuclear envelope, whereas (ii) shows these quantities in the presence of a selective interaction of active monomers with the inner surface of the simulated nucleus, both for a spherical nucleus. Note that only a small fraction (5%) of monomers are active and therefore feel the attraction due to the boundary. Such a marginal effect has strong consequences for positioning, inverting the conventional (active/euchromatin inside, inactive/heterochromatin outside) arrangement of chromosomes.
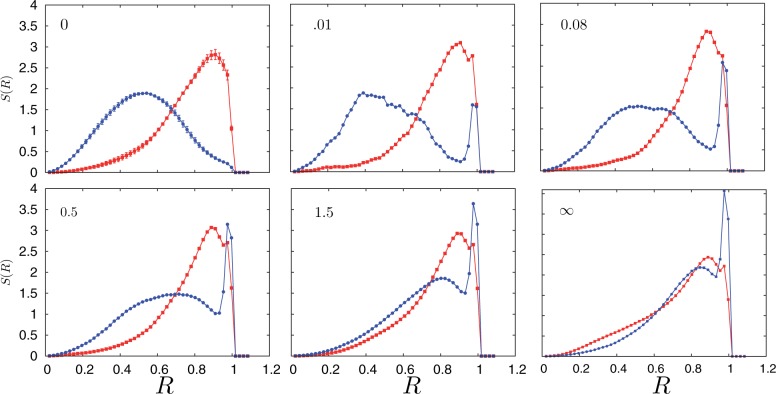
 denotes the steady state. This sequence illustrates how sequences intermediate between steady state ones can be attained and possibly stabilized by other processes, not included in the present description, yielding a broad variety of distributions in S(R).
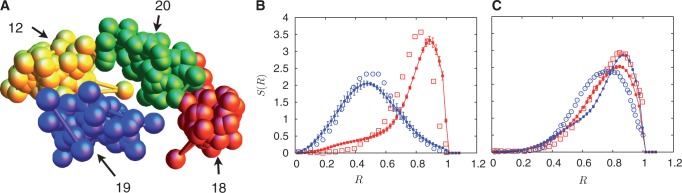
 , yielding ∼1400 loops for the 6098 monomers we consider. As before, probability distributions for chromosomes with similar gene densities, chromosomes 12 (red-filled squares) and 20 (blue-filled circles) in (C) show no segregation. Again, as before, the corresponding experimental data of another study (45) is shown as open symbols of the same color.
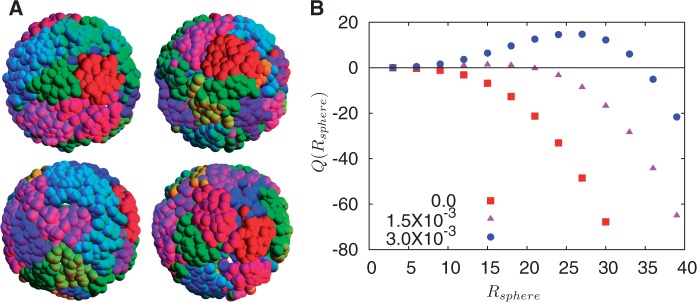
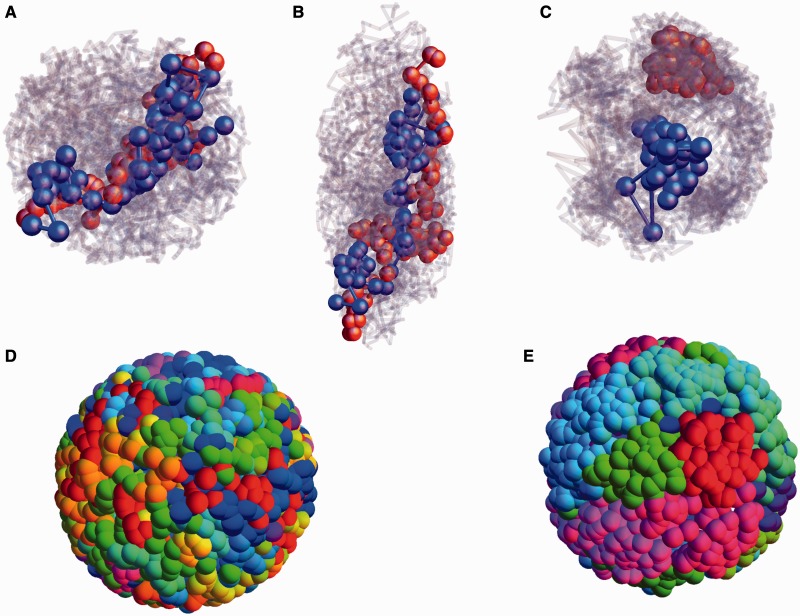
 , a quantity constructed by situating around each monomer a sphere of radius Rsphere, counting the number of monomers belonging to the same chromosome weighted by the quantity +1 and the number of monomers belonging to different chromosomes, weighted by –1. This quantity provides an indication of whether chromosomes are organized territorially and in a non-overlapping manner. We show results for three values of the looping probability: 0,
  and
and  . As the number of random loops is increased, leading to more compact chromosome configurations, the tendency for overlap is reduced, further enhancing the tendency to separate which is a consequence of activity-induced segregation.
Similar articles
-
Position of human chromosomes is conserved in mouse nuclei indicating a species-independent mechanism for maintaining genome organization.Chromosoma. 2008 Oct;117(5):499-509. doi: 10.1007/s00412-008-0171-7. Epub 2008 Jun 18. Chromosoma. 2008. PMID: 18563425 Free PMC article.
-
Nonequilibrium Biophysical Processes Influence the Large-Scale Architecture of the Cell Nucleus.Biophys J. 2020 May 5;118(9):2229-2244. doi: 10.1016/j.bpj.2019.11.017. Epub 2019 Nov 22. Biophys J. 2020. PMID: 31818465 Free PMC article.
-
Simulation of different three-dimensional polymer models of interphase chromosomes compared to experiments-an evaluation and review framework of the 3D genome organization.Semin Cell Dev Biol. 2019 Jun;90:19-42. doi: 10.1016/j.semcdb.2018.07.012. Epub 2018 Aug 24. Semin Cell Dev Biol. 2019. PMID: 30125668 Review.
-
Specific nuclear envelope transmembrane proteins can promote the location of chromosomes to and from the nuclear periphery.Genome Biol. 2013 Feb 15;14(2):R14. doi: 10.1186/gb-2013-14-2-r14. Genome Biol. 2013. PMID: 23414781 Free PMC article.
-
The function of nuclear architecture: a genetic approach.Annu Rev Genet. 2004;38:305-45. doi: 10.1146/annurev.genet.37.110801.142705. Annu Rev Genet. 2004. PMID: 15568979 Review.
Cited by
-
Epigenetic-structural changes in X chromosomes promote Xic pairing during early differentiation of mouse embryonic stem cells.Biophys Physicobiol. 2022 May 10;19:1-14. doi: 10.2142/biophysico.bppb-v19.0018. eCollection 2022. Biophys Physicobiol. 2022. PMID: 35797402 Free PMC article.
-
Predicting scale-dependent chromatin polymer properties from systematic coarse-graining.Nat Commun. 2023 Jul 11;14(1):4108. doi: 10.1038/s41467-023-39907-2. Nat Commun. 2023. PMID: 37433821 Free PMC article.
-
Differential Crosslinking and Contractile Motors Drive Nuclear Chromatin Compaction.ArXiv [Preprint]. 2025 Jul 23:arXiv:2507.17883v1. ArXiv. 2025. PMID: 40740516 Free PMC article. Preprint.
-
The rich inner life of the cell nucleus: dynamic organization, active flows, and emergent rheology.Biophys Rev. 2020 Oct;12(5):1093-1106. doi: 10.1007/s12551-020-00761-x. Epub 2020 Oct 16. Biophys Rev. 2020. PMID: 33064286 Free PMC article. Review.
-
How enzymatic activity is involved in chromatin organization.Elife. 2022 Dec 6;11:e79901. doi: 10.7554/eLife.79901. Elife. 2022. PMID: 36472500 Free PMC article.
References
-
- Meaburn K, Misteli T. Cell biology: chromosome territories. Nature. 2007;445:379–381. - PubMed
-
- Bickmore WA. The spatial organization of the human genome. Annu. Rev. Genomics Hum. Genet. 2013;14:67–84. - PubMed
-
- Cremer T, Cremer C. Chromosome territories, nuclear architecture and gene regulation in mammalian cells. Nat. Rev. Genet. 2001;2:292–301. - PubMed
Publication types
MeSH terms
LinkOut - more resources
Full Text Sources
Other Literature Sources
