. 2014 Mar 7;289(10):6341-6349.
doi: 10.1074/jbc.M113.511790. Epub 2014 Jan 23.

Defining the functional boundaries of the murine α1,3-fucosyltransferase Fut7 reveals a remarkably compact locus

Affiliations

Defining the functional boundaries of the murine α1,3-fucosyltransferase Fut7 reveals a remarkably compact locus

Mark E Ebel et al. J Biol Chem. .

Abstract

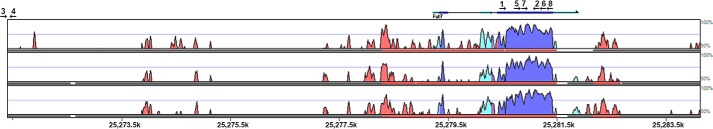
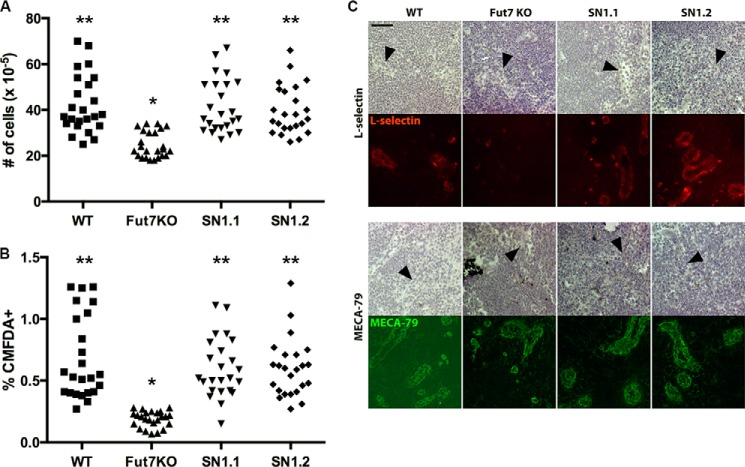
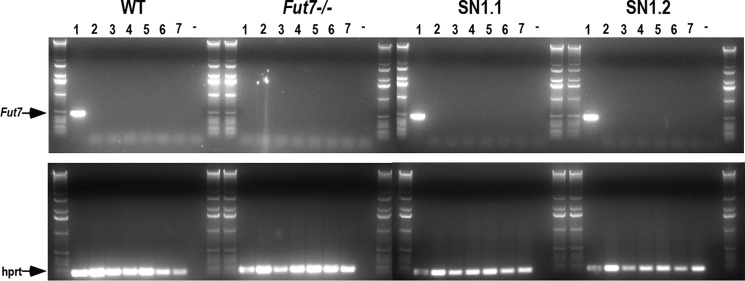
Fut7 encodes an α1,3-fucosyltransferase critical for biosynthesis of glycan ligands for all three selectins. Consistent with this function, Fut7 expression is limited to hematopoietic cells and high endothelial cells which express selectin ligands. Mechanisms that govern Fut7 expression are poorly defined. To begin to understand the molecular genetic basis for transcriptional regulation of Fut7, a transgenic, gain-of-function, genetic complementation approach in mice was used to define the "functional boundaries" of the murine Fut7 locus, defined here as any uninterupted stretch of genomic DNA that contains all cis-acting genetic elements essential for accurate physiologic expression. A 12.7-kb contiguous genomic interval, which lies completely between the highly conserved flanking Npdc1 and Abca2 loci on chromosome 2 and which contains the complete transcriptional unit plus ∼7.4 kb upstream of the transcriptional start site and ∼2 kb downstream of the transcriptional termination and polyadenylation sites, was used as a transgene (Tg) on a Fut7 null background. Tg+ mice exhibited restoration of Fut7 gene expression and physiologic levels of selectin ligand expression and function on neutrophils, activated T cells, and high endothelial cells and corrected the functional defects in these cells found in Fut7 null mice without leading to detectable expression of Fut7 in normally non-expressing tissues. These results demonstrate that all genetic information essential for appropriate and selective expression of Fut7 in diverse cell types and in response to distinct developmental signals is contained within this comparatively small genetic region.

Keywords: Cell Adhesion; Gene Expression; Glycobiology; Glycosyltransferases; Immunology; Leukocyte; Transcription Regulation.


Figures

FIGURE 1.
FIGURE 1.
Structure and conservation of the Fut7 locus and the SN1 Tg. Shown is a Vista-derived diagram of the genomic interval used as the SN1 Tg. Using the mouse as the base genome (not pictured), the conservation of the mouse with three other mammalian species (human, dog, horse, top to bottom) is depicted. The left (5′) edge of the figure represents the location of the SpeI site, and the right (3′) edge of the figure represents the location of the NotI site, initially used to excise this genomic interval from the original BAC clone. The major Fut7 transcriptional unit in the mouse is depicted at the top, aligned with the other species. The location of the major transcriptional start site (TSS) in the mouse is indicated as the left edge of the transcript at bp 7401 of the 12,729-bp SN1 Tg. Evolutionary conservation of the mouse with each of the indicated species is indicated by peaks, with colors indicating the nature of the sequence: dark blue/purple, coding; light blue, 5′- or 3′-untranslated sequence; pink, non-coding, i.e. conserved non-coding sequence. The scale goes from 50 to 100%, with 100% representing complete identity at the nucleotide level. Note that both coding and non-coding sequences of the murine mRNA are highly conserved in the other species, as are nearly all of the conserved noncoding sequences. Genomic position numbers for the mouse on chromosome 2 are indicated at the bottom. Oligonucleotides used for genotyping and other analysis are indicated by arrows, which give their orientation and numbers, which are in Table 1. Oligonucleotide 3, the SN1 sense oligo, is not part of native genomic DNA and is therefore “off scale” left. See “Results” for further details.
FIGURE 2.
FIGURE 2.
Gene copy number of the SN1 Fut7 Tg in SN1 Tg mice. Tg copy number in SN1 Tg mice was determined by qPCR of genomic DNA using two different pairs of primers, both within the catalytic domain of Fut7 (see Table 1). n = 4 for WT, and SN1.2 and n = 3 for SN1.1. Results for each mouse were normalized first against pgk2 primers for that mouse. The mean empirically determined gene copy number for each genotype for each primer was then determined. Finally, the normalized gene copy number was then calculated by normalizing for the WT = 2.
FIGURE 3.
FIGURE 3.
The SN1 Tg restores Fut7 and functional selectin ligand expression in neutrophils. A, flow cytometry analysis of E- and P-selectin ligand expression on blood neutrophils. Neutrophils were identified by characteristic forward and side scatter properties (gating not shown). Total blood cells were stained with anti-Gr-1, which identifies neutrophils, and E- or P-selectin/IgM chimera. B, qRT-PCR of Fut7 mRNA levels in neutrophils. For each mouse, results were first normalized to hprt for that mouse and then to the WT (=100%). One of two similar experiments is shown. C, absolute neutrophil numbers in peripheral blood of each genotype of mice. Each symbol represents a single mouse. D, total PEC recovered from the peritoneum of mice 4 h after intraperitoneal injection of 4% thioglycollate. Depicted is the mean ± S.D. for n = 12–16 for each genotype. For C and D: *, different (p < 0.01) from all other groups; **, no difference between groups.
FIGURE 4.
FIGURE 4.
Fut7 and functional selectin ligand expression in activated CD4 T cells in SN1 Tg mice. A, CD4 T cells were isolated, activated with plate-bound anti-CD3/CD28 without any added cytokine (none), with IL-12, or with TGFβ1, and subsequently cultured with IL-2 alone, IL-12 plus IL-2, or TGFβ1 plus IL-2 and analyzed by flow cytometry with selectin chimeras every 2 days. Depicted are the fractions that are positive for E-selectin ligands (top row) and P-selectin ligands (bottom row) for each genotype at each time point. Mean values ± S.D. from three experiments. B, qRT-PCR of Fut7 mRNA levels in activated CD4 T cells cultured with cytokines as above. Cells were harvested on day 6. As for neutrophils, values were normalized first to hprt levels. These values were then normalized to WT IL-2 only (=1) and expressed as -fold difference over WT IL-2 only. One of two similar experiments is shown. C, induction of E- and P-selectin ligands on splenic CD4 T cells in response to T. gondii infection. Spleens were harvested 7 days after intraperitoneal injection of T. gondii cysts. Plots are gated on CD4+ cells (gating not shown). Representative FACS plots of WT cells show that E- and P-selectin ligand-expressing cells are largely confined to the CD44-hi (activated) population. D, the fraction of CD44-hi CD4+ cells expressing ligands for either E- or P-selectin was calculated. Each symbol represents an individual mouse. E, total CD4+ PEC recovered on day 7 from each of the 4 genotypes of mice. For D and E: *, different (p < 0.01) from all other groups; **, no difference between groups.
FIGURE 5.
FIGURE 5.
Restoration of Fut7 expression and L-selectin ligands in HEC. A, total lymphocyte numbers isolated from individual axillary, brachial, and inguinal LNs of each genotype. LNs were harvested, single cell suspensions were prepared, and cells were counted. Each symbol represents a single LN in one mouse, with axillary, brachial, and inguinal LNs combined for each genotype. B, short term homing of labeled lymphocytes in mice of each genotype. Cells were labeled with CMFDA, washed, and injected into the tail vein. One hour later mice were sacrificed, and the axillary, brachial, and inguinal LNs were harvested, and single cell suspensions were prepared and analyzed by flow cytometry. As in A, each symbol represents a single LN in one mouse, with axillary, brachial, and inguinal LNs combined for each genotype. For A and B: *, different (p < 0.01) from all other groups; **, no difference between groups. C, expression of L-selectin ligands on HEC. Top, staining with L-RIgM; bottom, staining with MECA-79, which recognizes HEC regardless of Fut7 expression. The top set of panels in each case is brightfield, with HEC indicated by black arrowheads; the bottom set of panels is staining with either L-selectin or MECA-79. Each vertical pair (brightfield, fluorescence) depicts the same field. There was no detectable L-selectin binding in the presence of EDTA (not shown).
FIGURE 6.
FIGURE 6.
Absence of Fut7 expression in inappropriate cell types. Mice were anesthetized, perfused with PBS, sacrificed, and total RNA was isolated and reverse-transcribed, and PCR was performed on organs from WT, Fut7 KO, SN1.1, and SN1.2 mice. Lanes represent RT-PCR from bone marrow (1), brain (2), lung (3), liver (4), kidney (5), skeletal muscle (6), and small intestine (7). The dash (−) represents negative control of no cDNA input to the PCR reaction. Primers for hprt were used as a positive control on all samples (lower panels). The entire PCR reaction was run on 1% agarose gels, with each set of eight samples flanked by DNA size ladders.

References

    1. Gallatin W. M., Weissman I. L., Butcher E. C. (1983) A cell-surface molecule involved in organ-specific homing of lymphocytes. Nature 304, 30–34 - PubMed
    1. Lasky L. A., Singer M. S., Yednock T. A., Dowbenko D., Fennie C., Rodriguez H., Nguyen T., Stachel S., Rosen S. D. (1989) Cloning of a lymphocyte homing receptor reveals a lectin domain. Cell 56, 1045–1055 - PubMed
    1. Stoolman L. M., Yednock T. A., Rosen S. D. (1987) Homing receptors on human and rodent lymphocytes- evidence for a conserved carbohydrate-binding specificity. Blood 70, 1842–1850 - PubMed
    1. Kishimoto T. K., Jutila M. A., Butcher E. C. (1990) Identification of a human peripheral lymph node homing receptor. A rapidly down-regulated adhesion molecule. Proc. Natl. Acad. Sci. U.S.A. 87, 2244–2248 - PMC - PubMed
    1. Frenette P. S., Subbarao S., Mazo I. B., von Andrian U. H., Wagner D. D. (1998) Endothelial selectins and vascular adhesion molecule-1 promote hematopoietic progenitor homing to bone marrow. Proc. Natl. Acad. Sci. U.S.A. 95, 14423–14428 - PMC - PubMed

Publication types

LinkOut - more resources