. 2013 Dec 13:5:ecurrents.hd.5791c897b5c3bebeed93b1d1da0c0648.
doi: 10.1371/currents.hd.5791c897b5c3bebeed93b1d1da0c0648.

JAK/STAT Signalling in Huntington's Disease Immune Cells

Affiliations

JAK/STAT Signalling in Huntington's Disease Immune Cells

Ulrike Träger et al. PLoS Curr. .

Abstract

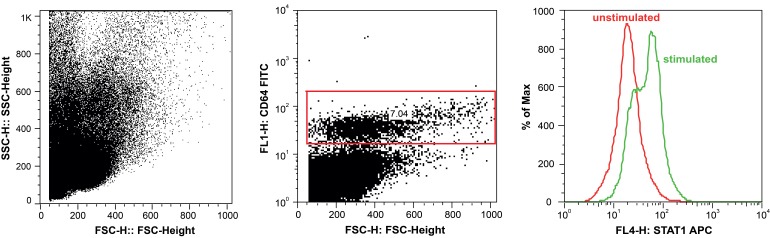
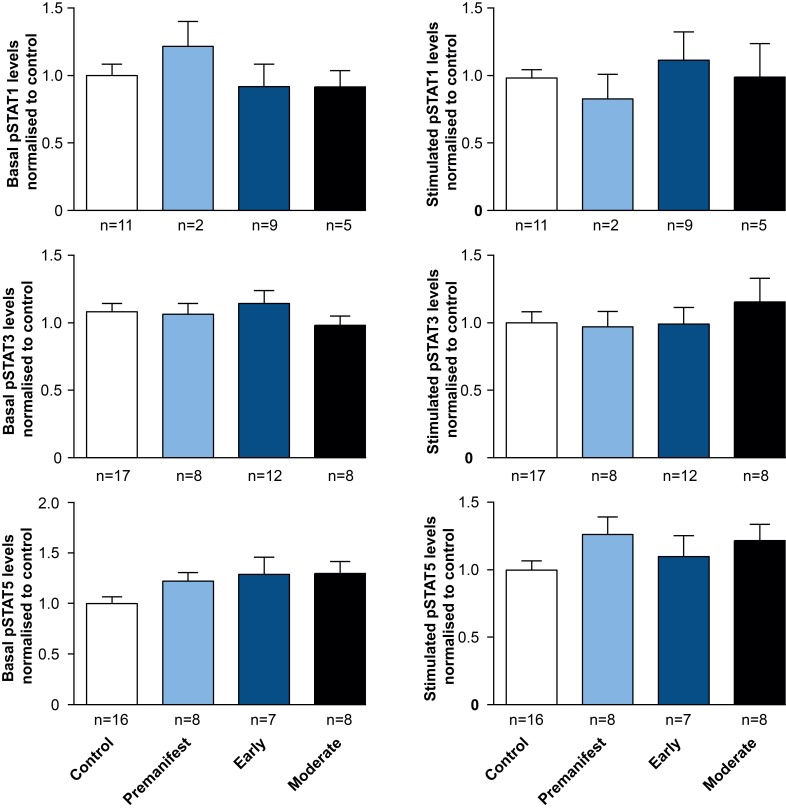
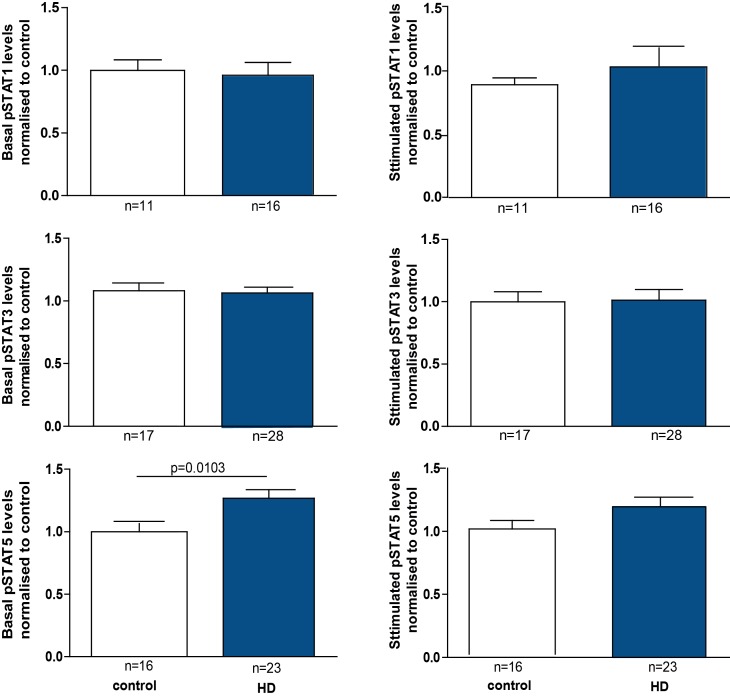
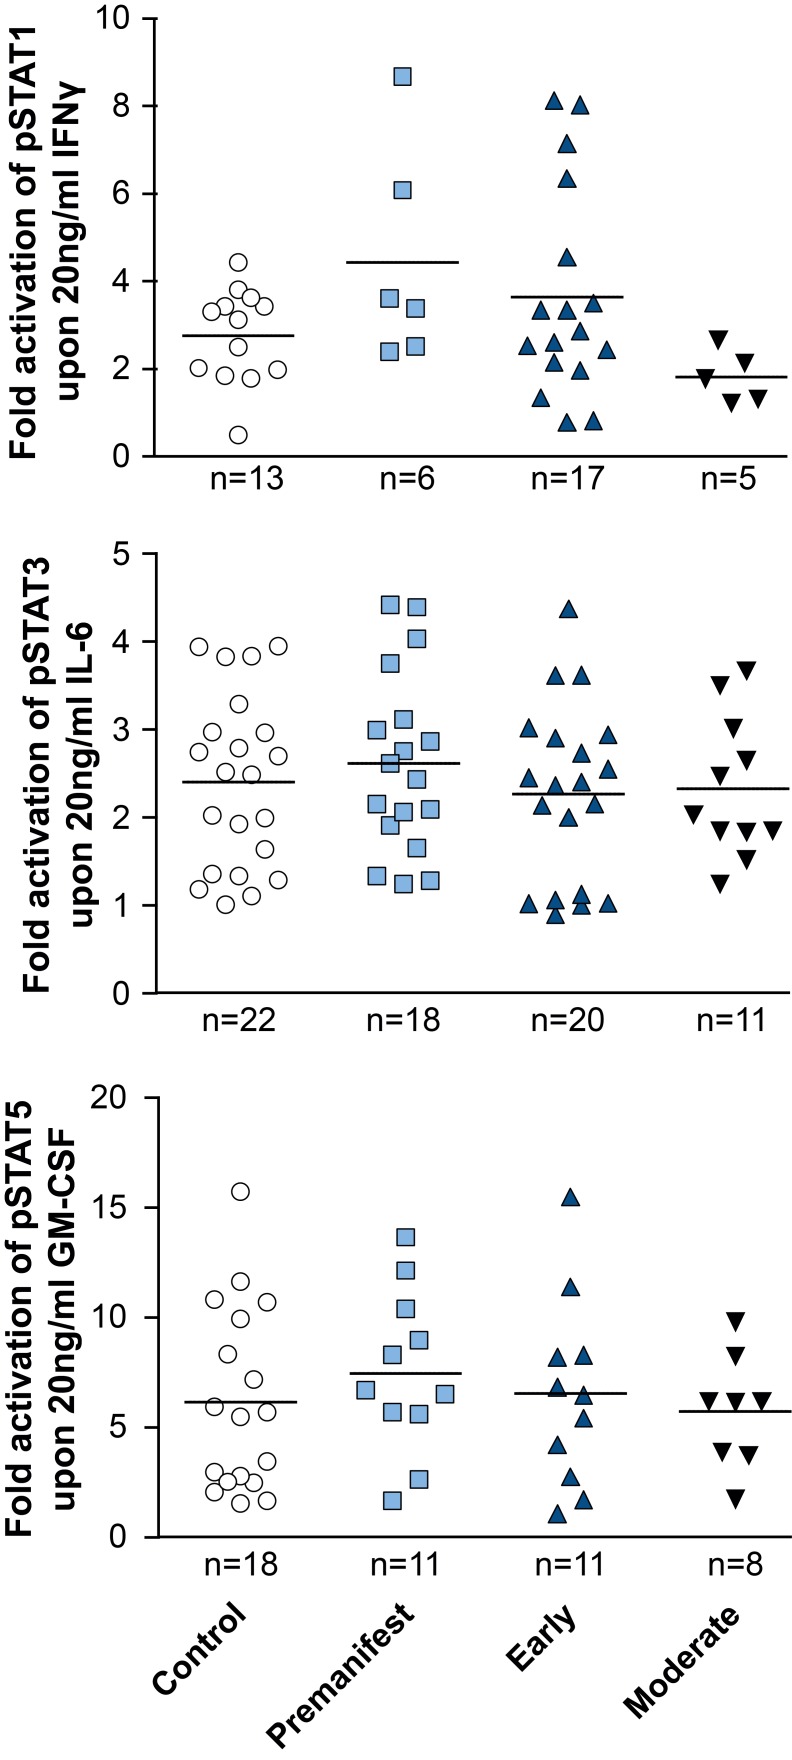
Huntington's disease (HD) is an inherited neurodegenerative disorder caused by a CAG repeat expansion in the huntingtin (HTT) gene. Both central and peripheral innate immune activation have been described as features of the disease. Isolated human HD monocytes have been shown to produce more cytokines upon LPS stimulation compared to control monocytes. Understanding alterations in the signalling cascades responsible and activated by this increase in pro-inflammatory cytokine production is crucial in understanding the molecular basis of this phenomenon. Here we investigated the signalling cascade most commonly activated by pro-inflammatory cytokines such as IL-6 - the JAK/STAT signalling cascade. Using flow cytometry, we show that one out of three key transcription factors activated by JAK/STAT signalling is altered in primary human HD innate immune cells, suggesting that this pathway may only play a minor, additive role in the immune cell dysfunction in HD.


Figures

Gating for STAT phosphoflow analysis.
PBMCs were isolated using density centrifugation, stimulated with, for example (as shown here) IFNγ to induce STAT1 phosphorylation. For flow cytometry analysis, monocytes were identified within the PBMC population by gating on CD64 positive cells (middle panel), before pSTAT levels were blotted as histogram (right panel). Overlay of unstimulated and IFNγ -stimulated cells showed a shift in pSTAT expression levels in monocytes. pSTAT levels were quantified as geometric mean. The same gating was used to measure pSTAT3 and 5 levels stimulated by IL-6 or GM-CSF, respectively.
STAT signalling appears normal in HD subjects’ monocytes.
PBMCs were isolated using gradient density centrifugation, stimulated with either IFNγ (for STAT1 activation), IL-6 (for STAT3 activation) or GM-CSF (for STAT5 activation) and stained for CD64 and pSTAT1, 3 and 5. Flow cytometry was used to assess the amount of pSTAT molecules in untreated and treated CD64+ monocytes. Data is shown as mean pSTAT levels normalised to control levels +/- SEM. One-way ANOVA was used as statistical measure and no statically significant difference was found.
pSTAT5 levels are increased in HD patient monocytes at baseline.
PBMCs were isolated using gradient density centrifugation, stimulated with either IFNγ (for STAT1 activation), IL-6 (for STAT3 activation) or GM-CSF (for STAT5 activation) and stained for CD64 and pSTAT1, 3 or 5. Flow cytometry was used to assess the amount of pSTAT molecules in untreated and treated CD64+ monocytes. Data is shown as mean pSTAT levels normalised to control levels +/- SEM. Two-way student t test was used for statistical analysis.
Activation of STAT signalling appears normal in HD patient monocytes.
PBMCs were isolated using density centrifugation, stimulated with IFNγ (for STAT1 activation), IL-6 (for STAT3 activation) or GM-CSF (for STAT5 activation) and stained for CD64 and STAT1, 3 and 5. Flow cytometry was used to assess the amount of pSTAT molecules before calculating the fold-activation by dividing post-treatment pSTAT levels by pre-treatment levels. Data shown as mean fold change +/-SEM. One-way ANOVA was used as statistical measure and no statistically significant difference was found.

Similar articles

Cited by

References

    1. Bates G, Harper PS, Jones L, editors (2002) Huntington's Disease. Oxford: Oxford University Press.
    1. Li SH, Schilling G, Young WS, Li XJ, Margolis RL, et al. (1993) Huntington's disease gene (IT15) is widely expressed in human and rat tissues. Neuron 11: 985-993. - PubMed
    1. van der Burg JM, Björkqvist M, Brundin P (2009) Beyond the brain: widespread pathology in Huntington's disease. Lancet Neurol 8: 765-774. - PubMed
    1. Björkqvist M, Wild EJ, Thiele J, Silvestroni A, Andre R, et al. (2008) A novel pathogenic pathway of immune activation detectable before clinical onset in Huntington's disease. J Exp Med 205: 1869-1877. - PMC - PubMed
    1. Weiss A, Träger U, Wild EJ, Grueninger S, Farmer R, et al. (2012) Mutant huntingtin fragmentation in immune cells tracks Huntington's disease progression. J Clin Invest 122: 3731-3736. - PMC - PubMed

LinkOut - more resources