Ultrasonographic scoring system score versus liver stiffness measurement in prediction of cirrhosis
- PMID: 24459644
- PMCID: PMC3894439
- DOI: 10.3350/cmh.2013.19.4.389
Ultrasonographic scoring system score versus liver stiffness measurement in prediction of cirrhosis
Abstract
Background/aims: We compared the cirrhosis-prediction accuracy of an ultrasonographic scoring system (USSS) combining six representative sonographic indices with that of liver stiffness measurement (LSM) by transient elastography, and prospectively investigated the correlation between the USSS score and LSM in predicting cirrhosis.
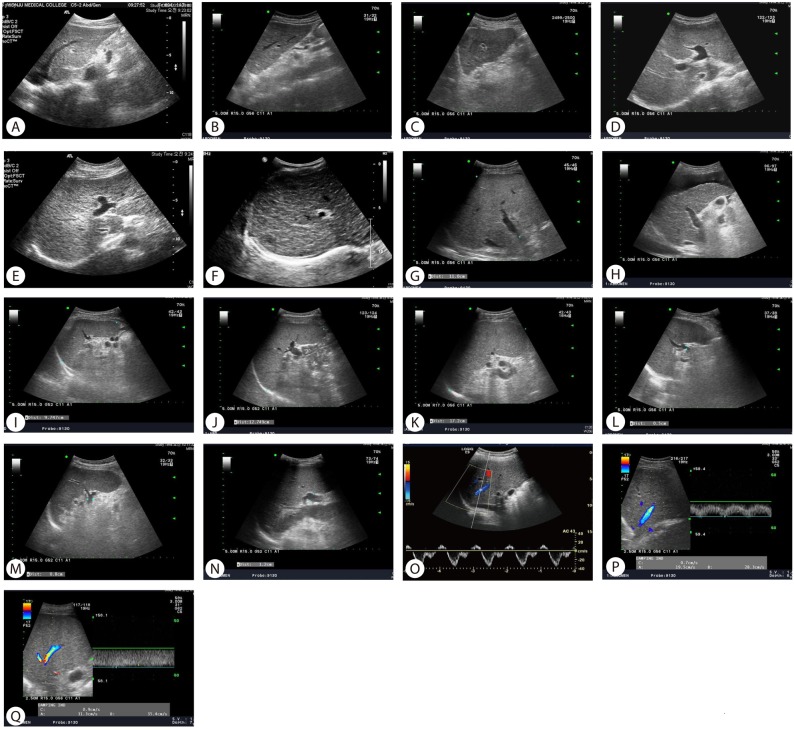
Methods: Two hundred and thirty patients with chronic liver diseases (187 men, 43 women; age, 50.4±9.5 y, mean±SD) were enrolled in this prospective study. The USSS produces a combined score for nodularity of the liver surface and edge, parenchyma echogenicity, presence of right-lobe atrophy, spleen size, splenic vein diameter, and abnormality of the hepatic vein waveform. The correlations of the USSS score and LSM with that of a pathological liver biopsy (METAVIR scoring system: F0-F4) were evaluated.
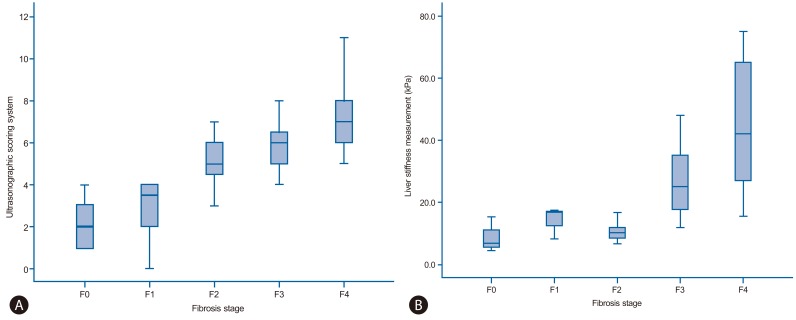
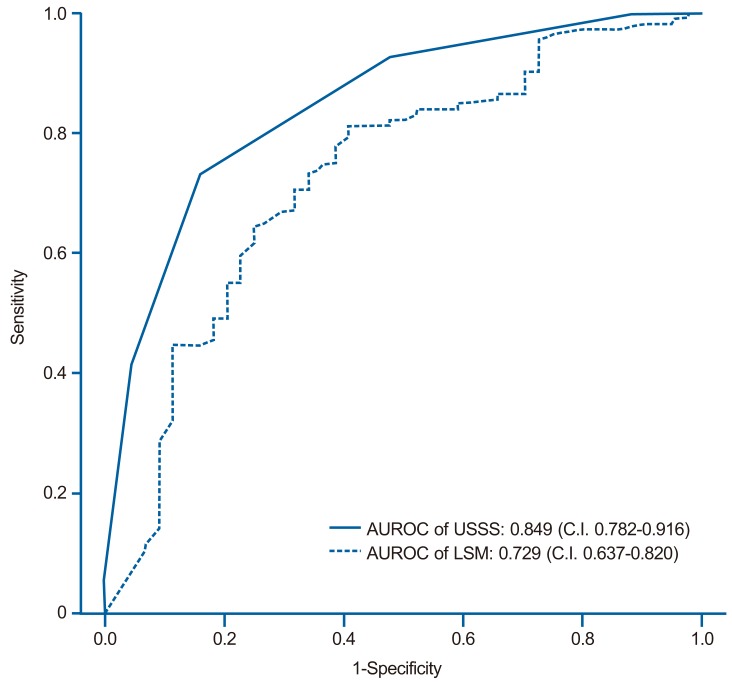
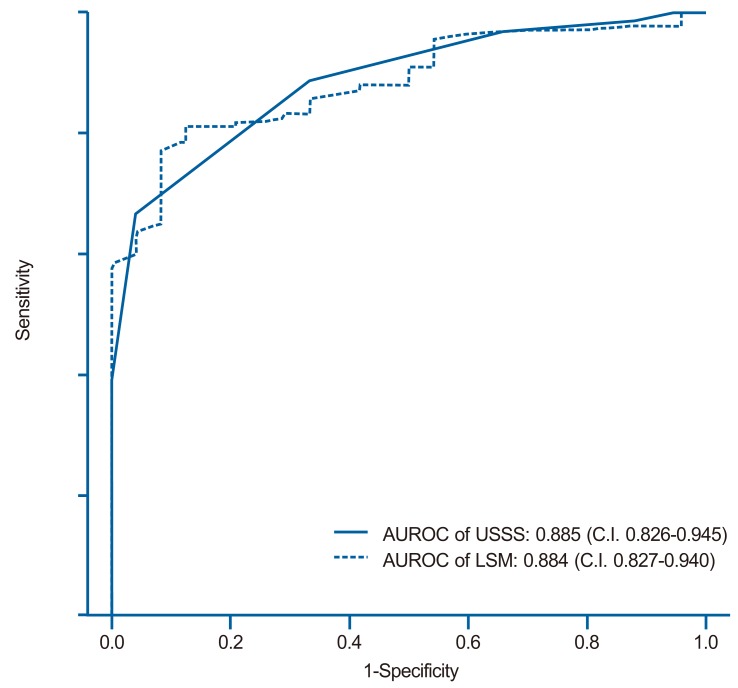
Results: The mean USSS score and LSM were 7.2 and 38.0 kPa, respectively, in patients with histologically overt cirrhosis (F4, P=0.017) and 4.3 and 22.1 kPa in patients with fibrotic change without overt cirrhosis (F0-F3) (P=0.025). The areas under the receiver operating characteristic (ROC) curves of the USSS score and LSM for F4 patients were 0.849 and 0.729, respectively. On the basis of ROC curves, criteria of USSS ≥6: LSM ≥17.4 had a sensitivity, specificity, positive predictive value, negative predictive value, and accuracy of 89.2%:77.6%, 69.4%:61.4%, 86.5%:83.7%, 74.6%:51.9% and 0.83:0.73, respectively, in predicting F4.
Conclusions: The results indicate that this USSS has comparable efficacy to LSM in the diagnosis of cirrhosis.
Keywords: Biopsy; Cirrhosis; Elastography; Ultrasonography.
Conflict of interest statement
The authors have no conflicts to disclose.
Figures
Similar articles
-
Assessment of liver fibrosis by Fibroscan as compared to liver biopsy in biliary atresia.World J Gastroenterol. 2015 Jun 14;21(22):6931-6. doi: 10.3748/wjg.v21.i22.6931. World J Gastroenterol. 2015. PMID: 26078570 Free PMC article.
-
Real time shear wave elastography in chronic liver diseases: accuracy for predicting liver fibrosis, in comparison with serum markers.World J Gastroenterol. 2014 Oct 14;20(38):13920-9. doi: 10.3748/wjg.v20.i38.13920. World J Gastroenterol. 2014. PMID: 25320528 Free PMC article.
-
Comparison between T1 relaxation time of Gd-EOB-DTPA-enhanced MRI and liver stiffness measurement of ultrasound elastography in the evaluation of cirrhotic liver.J Magn Reson Imaging. 2015 Feb;41(2):329-38. doi: 10.1002/jmri.24529. Epub 2013 Dec 17. J Magn Reson Imaging. 2015. PMID: 24343840
-
How can we enhance the performance of liver stiffness measurement using FibroScan in diagnosing liver cirrhosis in patients with chronic hepatitis B?J Clin Gastroenterol. 2010 Jan;44(1):66-71. doi: 10.1097/MCG.0b013e3181a95c7f. J Clin Gastroenterol. 2010. PMID: 19609218
-
Baseline values and changes in liver stiffness measured by transient elastography are associated with severity of fibrosis and outcomes of patients with primary sclerosing cholangitis.Gastroenterology. 2014 Apr;146(4):970-9; quiz e15-6. doi: 10.1053/j.gastro.2013.12.030. Epub 2013 Dec 31. Gastroenterology. 2014. PMID: 24389304
Cited by
-
An endoplasmic reticulum protein, Nogo-B, facilitates alcoholic liver disease through regulation of kupffer cell polarization.Hepatology. 2017 May;65(5):1720-1734. doi: 10.1002/hep.29051. Epub 2017 Mar 22. Hepatology. 2017. PMID: 28090670 Free PMC article.
-
Mesenchymal stem cell therapy for cirrhosis: Present and future perspectives.World J Gastroenterol. 2015 Sep 28;21(36):10253-61. doi: 10.3748/wjg.v21.i36.10253. World J Gastroenterol. 2015. PMID: 26420953 Free PMC article. Review.
-
Mesenchymal stem cell therapy for liver fibrosis.Korean J Intern Med. 2015 Sep;30(5):580-9. doi: 10.3904/kjim.2015.30.5.580. Epub 2015 Aug 27. Korean J Intern Med. 2015. PMID: 26354051 Free PMC article. Review.
-
Application of ultrasound for the diagnosis of cirrhosis/portal hypertension.J Med Ultrason (2001). 2022 Jul;49(3):321-331. doi: 10.1007/s10396-022-01191-w. Epub 2022 Feb 18. J Med Ultrason (2001). 2022. PMID: 35179669 Review.
-
Combining hepatic surface nodularity and serum tests better predicts hepatic fibrosis stages in chronic liver disease.Abdom Radiol (NY). 2021 Sep;46(9):4189-4199. doi: 10.1007/s00261-021-03113-9. Epub 2021 May 12. Abdom Radiol (NY). 2021. PMID: 33977353
References
-
- Bravo AA, Sheth SG, Chopra S. Liver biopsy. N Engl J Med. 2001;344:495–500. - PubMed
-
- Garcia-Tsao G, Boyer JL. Outpatient liver biopsy: how safe is it? Ann Intern Med. 1993;118:150–153. - PubMed
-
- Sandrin L, Fourquet B, Hasquenoph JM, Yon S, Fournier C, Mal F, et al. Transient elastography: a new noninvasive method for assessment of hepatic fibrosis. Ultrasound Med Biol. 2003;29:1705–1713. - PubMed
-
- Castéra L, Vergniol J, Foucher J, Le Bail B, Chanteloup E, Haaser M, et al. Prospective comparison of transient elastography, Fibrotest, APRI, and liver biopsy for the assessment of fibrosis in chronic hepatitis C. Gastroenterology. 2005;128:343–350. - PubMed
Publication types
MeSH terms
LinkOut - more resources
Full Text Sources
Other Literature Sources
Medical
Miscellaneous