

Effects of diphenyl diselenide on methylmercury toxicity in rats
- PMID: 24459674
- PMCID: PMC3891606
- DOI: 10.1155/2013/983821
Effects of diphenyl diselenide on methylmercury toxicity in rats
Abstract
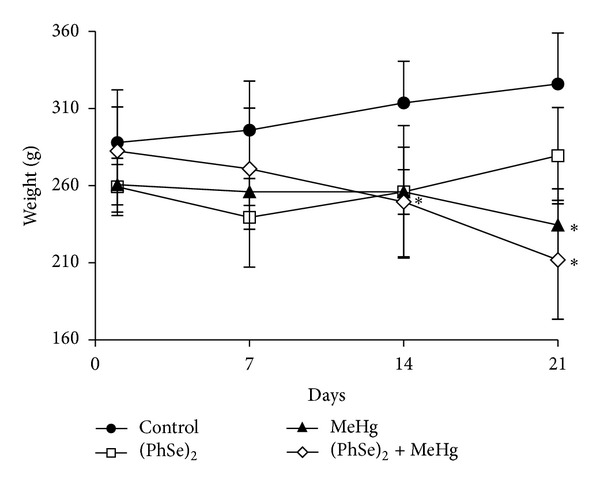
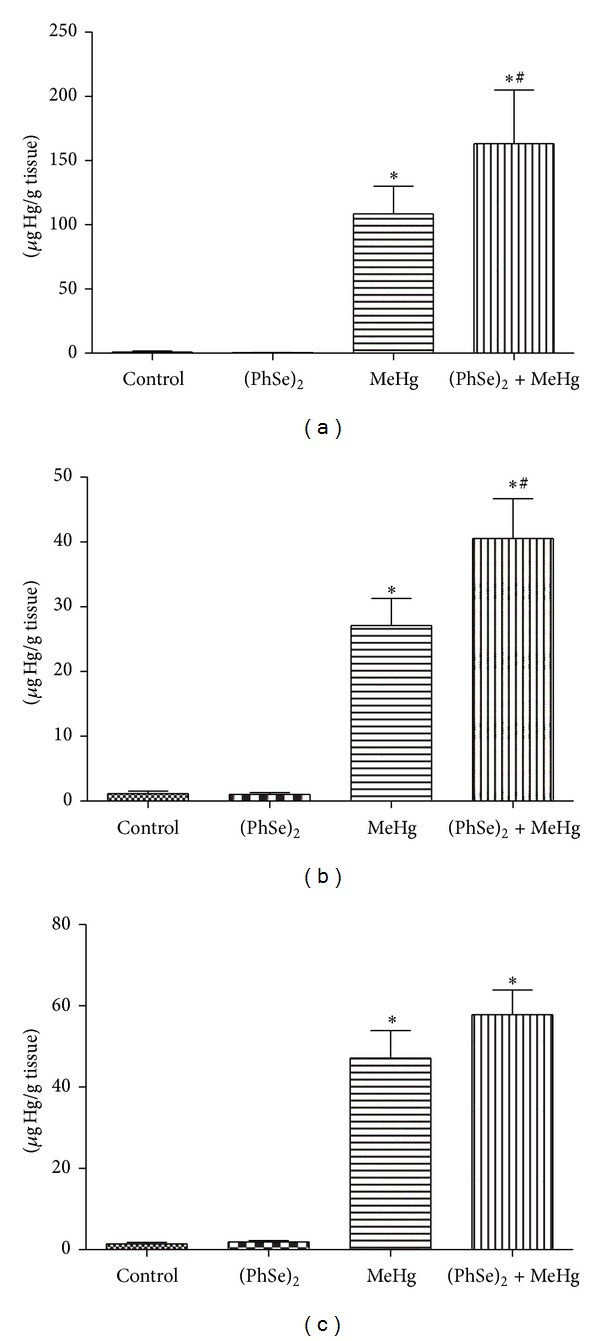
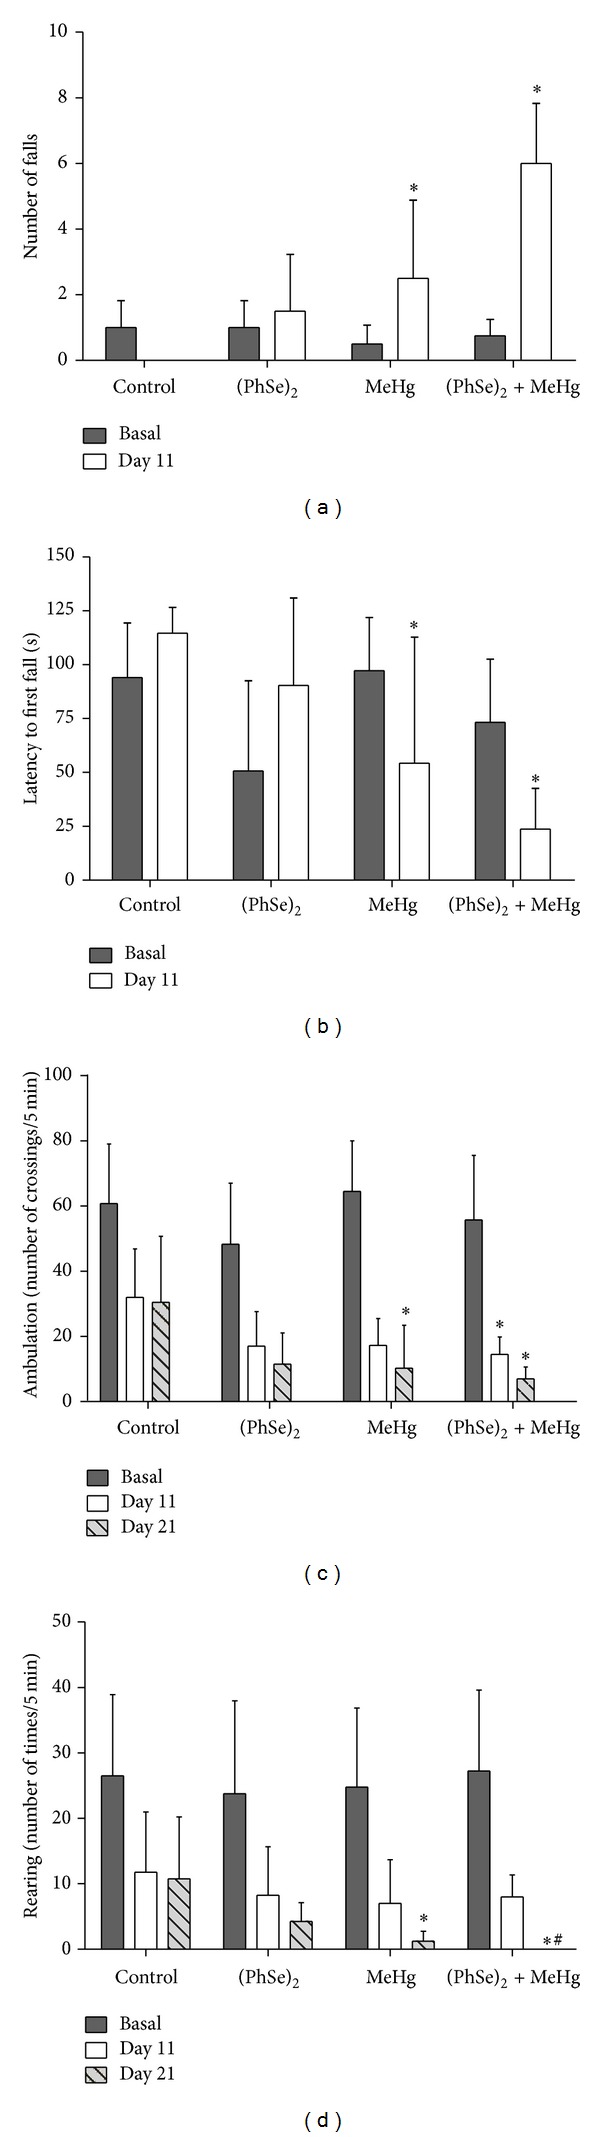
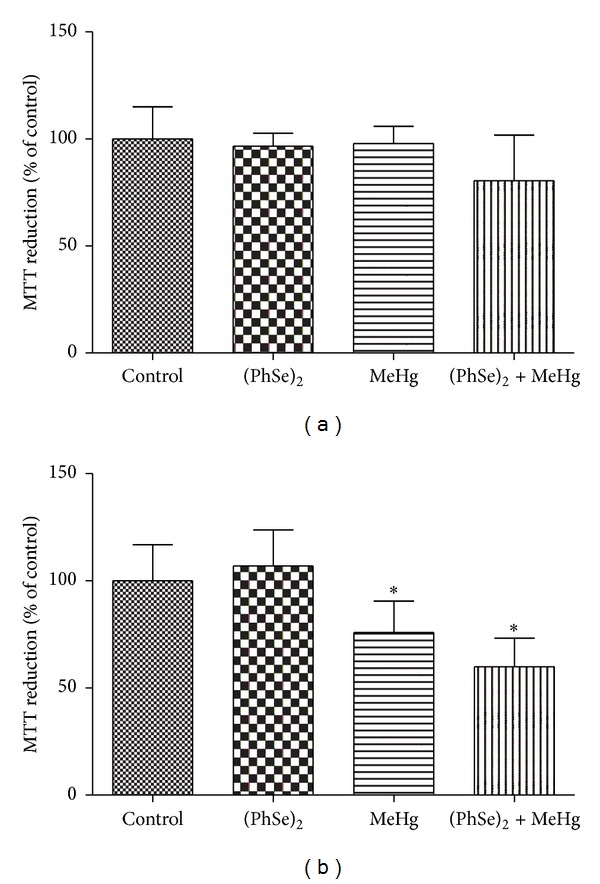
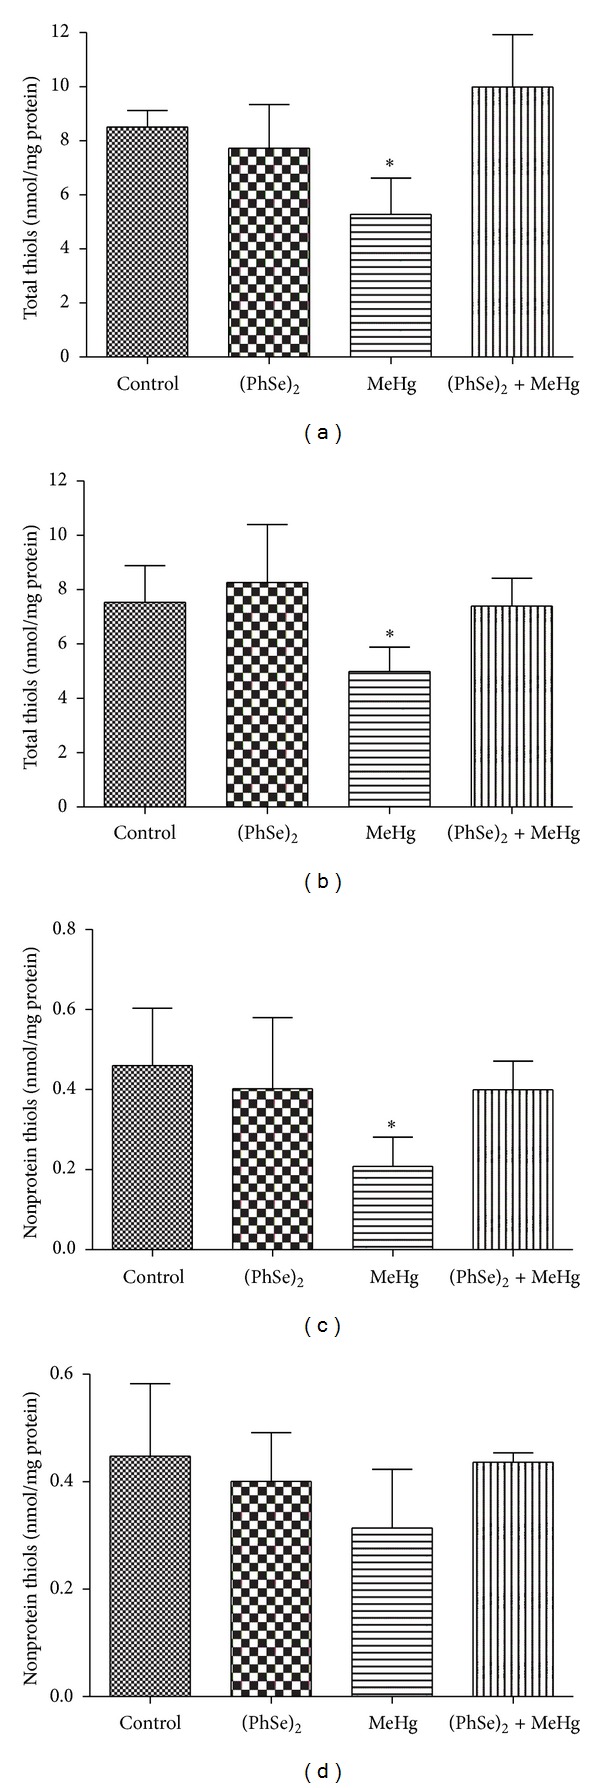
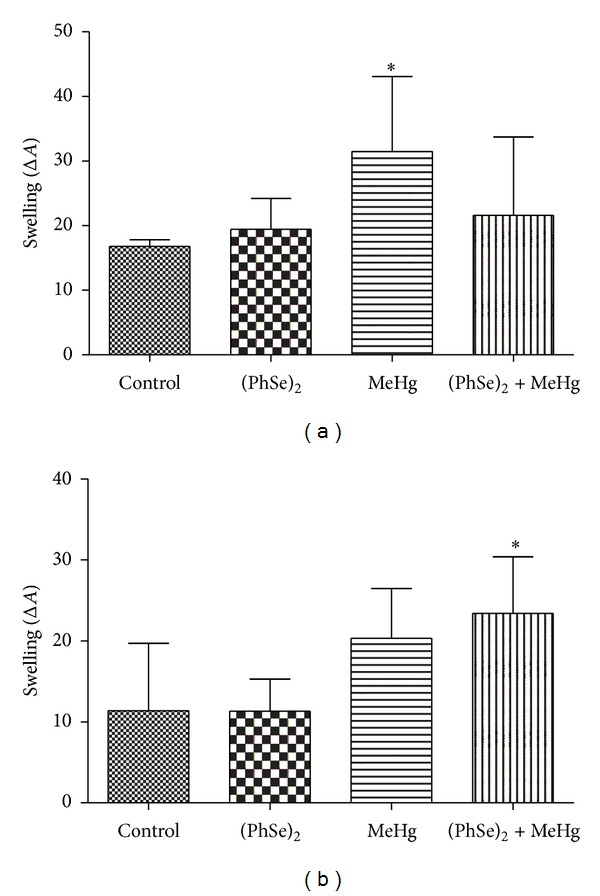
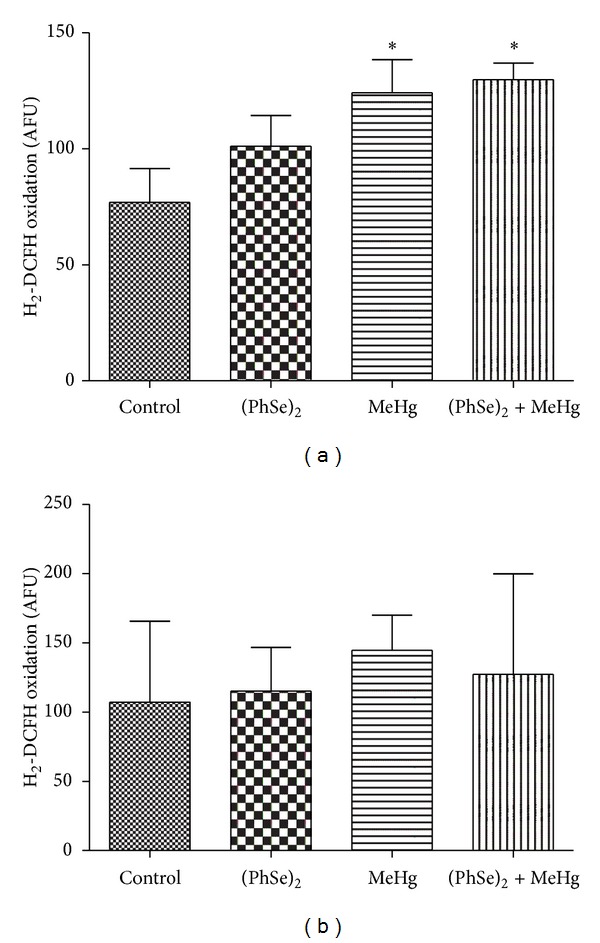
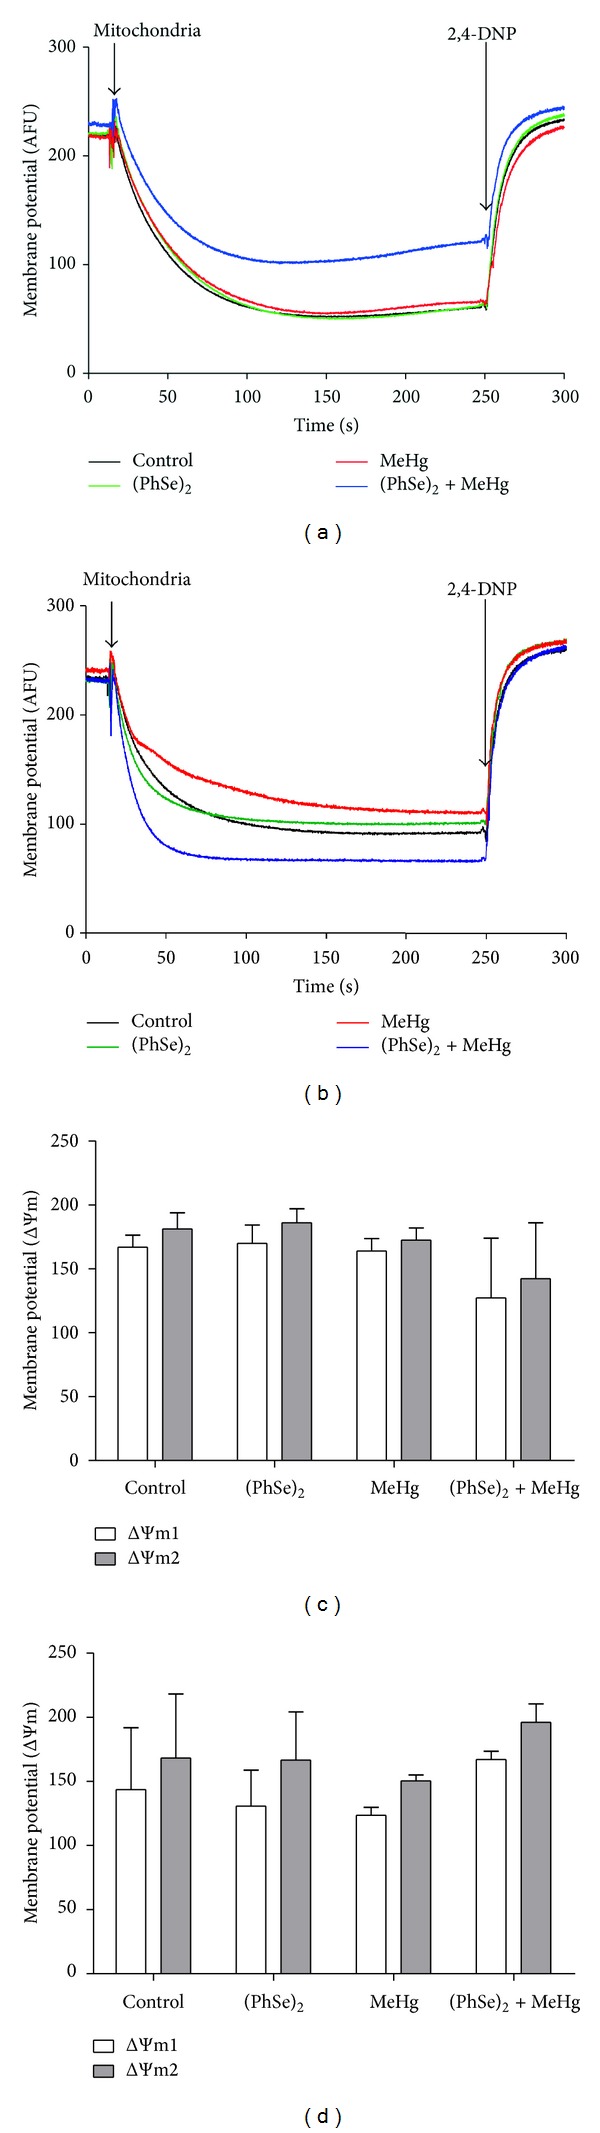
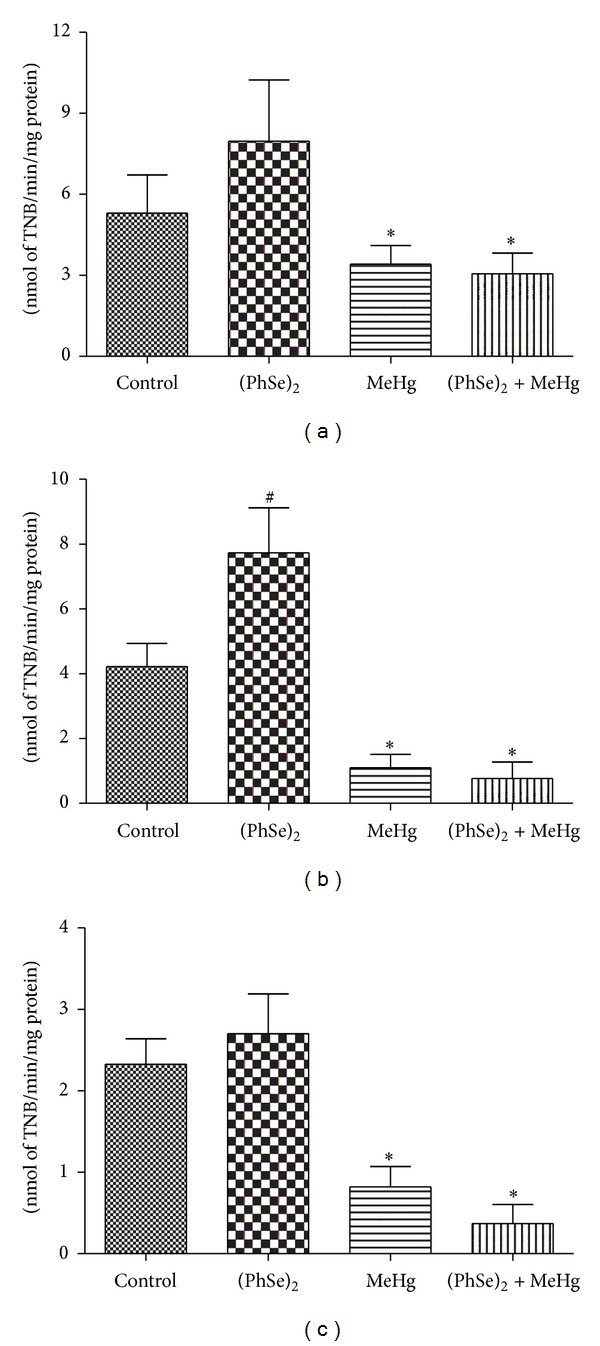
This study investigates the efficacy of diphenyl diselenide [(PhSe)2] in attenuating methylmercury- (MeHg-)induced toxicity in rats. Adult rats were treated with MeHg [5 mg/kg/day, intragastrically (i.g.)] and/ or (PhSe)2 [1 mg/kg/day, intraperitoneally (i.p.)] for 21 days. Body weight gain and motor deficits were evaluated prior to treatment, on treatment days 11 and 21. In addition, hepatic and cerebral mitochondrial function (reactive oxygen species (ROS) formation, total and nonprotein thiol levels, membrane potential (ΔΨm), metabolic function, and swelling), hepatic, cerebral, and muscular mercury levels, and hepatic, cerebral, and renal thioredoxin reductase (TrxR) activity were evaluated. MeHg caused hepatic and cerebral mitochondrial dysfunction and inhibited TrxR activity in liver (38,9%), brain (64,3%), and kidney (73,8%). Cotreatment with (PhSe)2 protected hepatic and cerebral mitochondrial thiols from depletion by MeHg but failed to completely reverse MeHg's effect on hepatic and cerebral mitochondrial dysfunction or hepatic, cerebral, and renal inhibition of TrxR activity. Additionally, the cotreatment with (PhSe)2 increased Hg accumulation in the liver (50,5%) and brain (49,4%) and increased the MeHg-induced motor deficits and body-weight loss. In conclusion, these results indicate that (PhSe)2 can increase Hg body burden as well as the neurotoxic effects induced by MeHg exposure in rats.
Figures
Similar articles
-
Diphenyl diselenide, a simple organoselenium compound, decreases methylmercury-induced cerebral, hepatic and renal oxidative stress and mercury deposition in adult mice.Brain Res Bull. 2009 Apr 6;79(1):77-84. doi: 10.1016/j.brainresbull.2008.11.001. Epub 2008 Nov 29. Brain Res Bull. 2009. PMID: 19047014
-
Diphenyl diselenide protects against methylmercury-induced inhibition of thioredoxin reductase and glutathione peroxidase in human neuroblastoma cells: a comparison with ebselen.J Appl Toxicol. 2017 Sep;37(9):1073-1081. doi: 10.1002/jat.3458. Epub 2017 Apr 6. J Appl Toxicol. 2017. PMID: 28383113
-
Selenium and mercury levels in rat liver slices co-treated with diphenyl diselenide and methylmercury.Biometals. 2016 Jun;29(3):543-50. doi: 10.1007/s10534-016-9936-2. Epub 2016 May 2. Biometals. 2016. PMID: 27138944
-
Methylmercury and diphenyl diselenide interactions in Drosophila melanogaster: effects on development, behavior, and Hg levels.Environ Sci Pollut Res Int. 2018 Aug;25(22):21568-21576. doi: 10.1007/s11356-018-2293-7. Epub 2018 May 21. Environ Sci Pollut Res Int. 2018. PMID: 29785592
-
Diphenyl diselenide administration enhances cortical mitochondrial number and activity by increasing hemeoxygenase type 1 content in a methylmercury-induced neurotoxicity mouse model.Mol Cell Biochem. 2014 May;390(1-2):1-8. doi: 10.1007/s11010-013-1870-9. Epub 2014 Mar 13. Mol Cell Biochem. 2014. PMID: 24623265
Cited by
-
Development of a sensor to detect methylmercury toxicity.Sci Rep. 2024 Sep 18;14(1):21832. doi: 10.1038/s41598-024-72788-z. Sci Rep. 2024. PMID: 39294331 Free PMC article.
-
Toxicology and pharmacology of synthetic organoselenium compounds: an update.Arch Toxicol. 2021 Apr;95(4):1179-1226. doi: 10.1007/s00204-021-03003-5. Epub 2021 Apr 1. Arch Toxicol. 2021. PMID: 33792762 Free PMC article. Review.
-
Oxidative Stress in Methylmercury-Induced Cell Toxicity.Toxics. 2018 Aug 9;6(3):47. doi: 10.3390/toxics6030047. Toxics. 2018. PMID: 30096882 Free PMC article. Review.
-
Methylmercury exposure develops atherosclerotic risk factors in the aorta and programmed cell death in the cerebellum: ameliorative action of Celastrus paniculatus ethanolic extract in male Wistar rats.Environ Sci Pollut Res Int. 2018 Oct;25(30):30212-30223. doi: 10.1007/s11356-018-3031-x. Epub 2018 Aug 28. Environ Sci Pollut Res Int. 2018. PMID: 30155631
-
The catecholaminergic neurotransmitter system in methylmercury-induced neurotoxicity.Adv Neurotoxicol. 2017;1:47-81. doi: 10.1016/bs.ant.2017.07.002. Epub 2017 Sep 1. Adv Neurotoxicol. 2017. PMID: 32346666 Free PMC article. No abstract available.
References
-
- Carvalho CML, Lu J, Zhang X, Arnér ESJ, Holmgren A. Effects of selenite and chelating agents on mammalian thioredoxin reductase inhibited by mercury: implications for treatment of mercury poisoning. The FASEB Journal. 2011;25(1):370–381. - PubMed
-
- Clarkson TW, Magos L, Myers GJ. The toxicology of mercury—current exposures and clinical manifestations. The New England Journal of Medicine. 2003;349(18):1731–1737. - PubMed
-
- Dórea JG. Persistent, bioaccumulative and toxic substances in fish: human health considerations. Science of the Total Environment. 2008;400(1–3):93–114. - PubMed
Publication types
MeSH terms
Substances
Grants and funding
LinkOut - more resources
Full Text Sources
Other Literature Sources
