. 2014 Jan 24:7:5.
doi: 10.1186/1755-8794-7-5.

Comprehensive interrogation of CpG island methylation in the gene encoding COMT, a key estrogen and catecholamine regulator

Affiliations

Comprehensive interrogation of CpG island methylation in the gene encoding COMT, a key estrogen and catecholamine regulator

Theresa Swift-Scanlan et al. BMC Med Genomics. .

Abstract

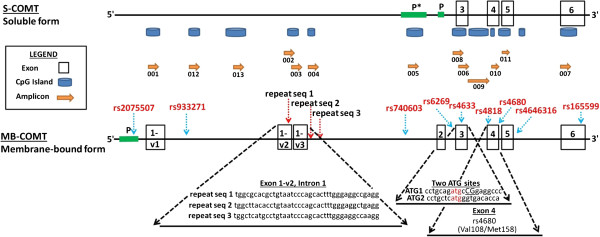
Background: The catechol-O-methyltransferase (COMT) enzyme has been widely studied due to its multiple roles in neurological functioning, estrogen biology, and methylation metabolic pathways. Numerous studies have investigated variation in the large COMT gene, with the majority focusing on single nucleotide polymorphisms (SNPs). This body of work has linked COMT genetic variation with a vast array of conditions, including several neurobehavioral disorders, pain sensitivity, and multiple human cancers. Based on COMT's numerous biological roles and recent studies suggesting that methylation of the COMT gene impacts COMT gene expression, we comprehensively interrogated methylation in over 200 CpG dinucleotide sequences spanning the length of the COMT gene.

Methods: Using saliva-derived DNA from a non-clinical sample of human subjects, we tested for associations between COMT CpG methylation and factors reported to interact with COMT genetic effects, including demographic factors and alcohol use. Finally, we tested associations between COMT CpG methylation state and COMT gene expression in breast cancer cell lines. We interrogated >200 CpGs in 13 amplicons spanning the 5' UTR to the last exon of the CpG dinucleotide-rich COMT gene in n = 48 subjects, n = 11 cell lines and 1 endogenous 18S rRNA control.

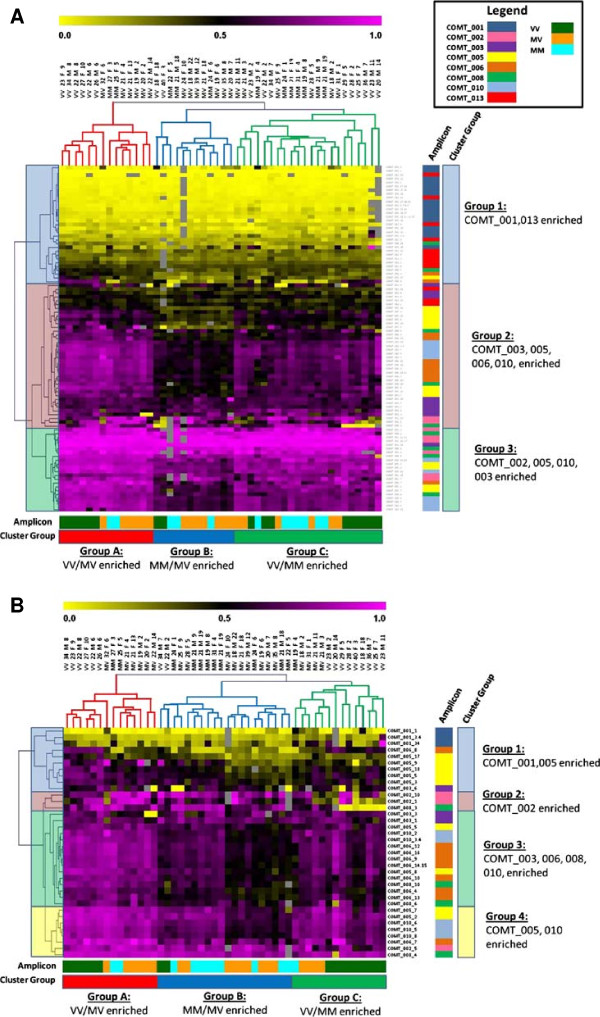
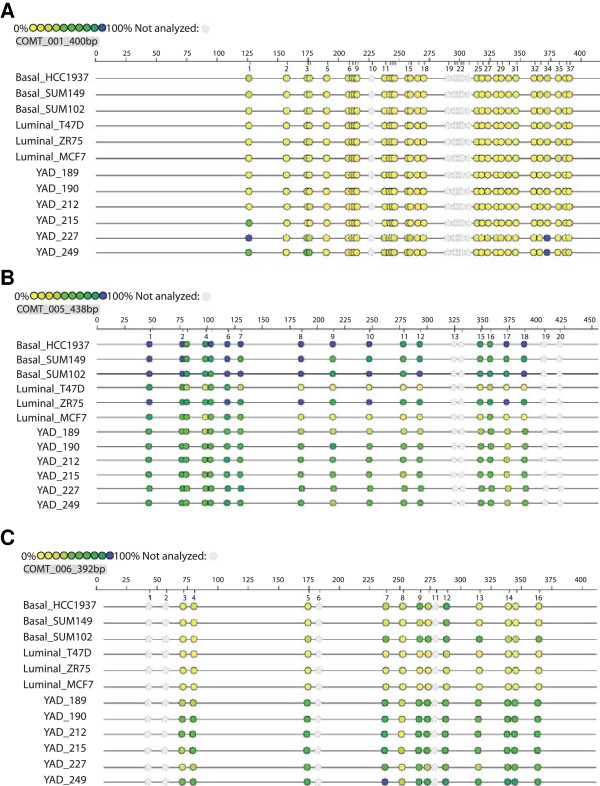
Results: With the exception of the CpG island in the 5'UTR and 1st exon, all other CpG islands were strongly methylated with typical dynamic ranges between 50-90%. In the saliva samples, methylation of multiple COMT loci was associated with socioeconomic status or ethnicity. We found associations between methylation at numerous loci and genotype at the functional Val158Met SNP (rs4680), and most of the correlations between methylation and demographic and alcohol use factors were Val158Met allele-specific. Methylation at several of these loci also associated with COMT gene expression in breast cancer cell lines.

Conclusions: We report the first comprehensive interrogation of COMT methylation. We corroborate previous findings of variation in COMT methylation with gene expression and the Val158Met genotype, and also report novel associations with socioeconomic status (SES) and ethnicity at several methylated loci. These results point to novel mechanisms for COMT regulation, which may have broad therapeutic implications.


Figures

Figure 1
Figure 1
COMT gene features relative to amplicons interrogated for methylation. COMT spans ~32 kb (chromosome 22q11.21, human build NCBI 37/hg 19, bp 19925733 – 19957832), with two major transcript variants encoding soluble and membrane bound (S-COMT and MB-COMT) enzyme forms, respectively (drawn to scale). 13 amplicons (001–013, orange arrows), were designed to interrogate methylation in CpG islands (blue cylinders) throughout COMT. Previously identified SNPs associated with impulsivity or pain sensitivity are listed by rs number (red font), with approximate SNP position indicated by blue vertical arrows. Top row: The S-COMT variant is encoded by four exons (black lined white boxes), regulated by promoter P1 (green bar), and possibly by a predicted promoter (PP) 5’ of P1. Bottom Row: The MB-COMT is encoded by 6 exons (with multiple possible variants of exon 1 (1-v1, 1-v2, 1-v3). Expanded view (dashed diagonal lines), highlight three ~40 bp repeat sequence motifs that we identified spanning ~1.5 kb beginning in exon 1-v2 through intron 1; the ATG1 and ATG2 translational start sites (TSS) in Exon 3 for S-COMT and MB-COMT, respectively; and the rs4680 SNP in Exon 4 encoding the substitution of valine (val) with methionine (met) at codon 158.
Figure 2
Figure 2
Hierarchical clustering analysis of COMT methylation in the UNC dataset. The clustergram is highlighted on the left to display the major clada or related groups of methylated CpGs for each dataset. Percent methylation is represented on a color continuum of bright yellow (0%), black (50%) to bright purple (100%). Colored bars on the right of the clustergram display the amplicon members of each group. (COMT_001 = dark blue, COMT_002 = salmon, COMT_003 = purple, COMT_005 = yellow, COMT_006 = purple, COMT_008 = green, COMT_010 = light blue, COMT_013 = red). Unsupervised hierarchical clustering analysis (HCA) by CpG unit of A 48 subjects and 110 CpGs shows 3 groups of subjects by COMT Val158Met genotype, age, sex, and alcohol use (AUDIT score). Group A is enriched for VV + MV genotypes, Group B for MM + MV genotypes and high AUDIT scores, and Group C for VV + MM genotypes. B Clustergram reveals the 39 most differentially methylated CpGs after applying a 40% standard deviation filter, after which Group C becomes predominantly VV genotype enriched.
Figure 3
Figure 3
Epigrams of amplicons illustrate variable methylation by sample type. The Sequenom EpiTYPER MassARRAY platform was used to calculate percent methylation for CpG dinucleotides within each of the three amplicons shown. The epigram schematic illustrates percent methylation for each consecutive CpG (colored circle) on a continuum from yellow (0%) to navy blue (100%). Shaded circles represent CpGs that could not be quantified because they fell outside the Mass Dalton allowable detection window of the EpiTYPER software. Twelve samples per amplicon are shown to illustrate differential methylation: Rows 1–6 represent two groups of biologically distinct breast cancer cell lines (three basal-like and three luminal breast cancer cell lines respectively). Rows 7–12 are from six different healthy saliva samples. A. Amplicon COMT_001 is located in the CpG island 5’ and including exon 1 (Figure  1) and is relatively hypomethylated, with CpGs 1,3,4, and 34 showing the most heterogeneity across sample type. B. Amplicon COMT_005, located in the CpG island within the predicted promoter (P*) for S-COMT, is relatively hypermethylated for CpGs 1–7 for all samples, and most differentially methylated between CpGs 8–18 as illustrated by breast cell line samples T47D & MCF7, & saliva sample YAD189. C. Amplicon COMT_006, is located in Exon 3 (Figure  1), and like COMT_005, is homogeneously methylated at the beginning of the amplicon (CpGs 1–6), with differential methylation occurring between CpGs 7–16, as evidenced by relative hypermethylation of these loci in the basal versus the luminal cell lines.

References

    1. Mannisto PT, Kaakkola S. Catechol-O-methyltransferase (COMT): biochemistry, molecular biology, pharmacology, and clinical efficacy of the new selective COMT inhibitors. Pharmacol Rev. 1999;7:593–628. - PubMed
    1. Lavigne JA, Helzlsouer KJ, Huang HY, Strickland PT, Bell DA, Selmin O, Watson MA, Hoffman S, Comstock GW, Yager JD. An association between the allele coding for a low activity variant of catechol-O-methyltransferase and the risk for breast cancer. Cancer Res. 1997;7:5493–5497. - PubMed
    1. Diatchenko L, Slade GD, Nackley AG, Bhalang K, Sigurdsson A, Belfer I, Goldman D, Xu K, Shabalina SA, Shagin D. et al.Genetic basis for individual variations in pain perception and the development of a chronic pain condition. Hum Mol Genet. 2005;7:135–143. - PubMed
    1. Zubieta JK, Heitzeg MM, Smith YR, Bueller JA, Xu K, Xu Y, Koeppe RA, Stohler CS, Goldman D. COMT val158met genotype affects mu-opioid neurotransmitter responses to a pain stressor. Science. 2003;7:1240–1243. doi: 10.1126/science.1078546. - DOI - PubMed
    1. Egan MF, Goldberg TE, Kolachana BS, Callicott JH, Mazzanti CM, Straub RE, Goldman D, Weinberger DR. Effect of COMT Val108/158 Met genotype on frontal lobe function and risk for schizophrenia. Proc Natl Acad Sci U S A. 2001;7:6917–6922. doi: 10.1073/pnas.111134598. - DOI - PMC - PubMed

Publication types

LinkOut - more resources