

CA3 retrieves coherent representations from degraded input: direct evidence for CA3 pattern completion and dentate gyrus pattern separation
- PMID: 24462102
- PMCID: PMC3904133
- DOI: 10.1016/j.neuron.2013.11.017
CA3 retrieves coherent representations from degraded input: direct evidence for CA3 pattern completion and dentate gyrus pattern separation
Abstract
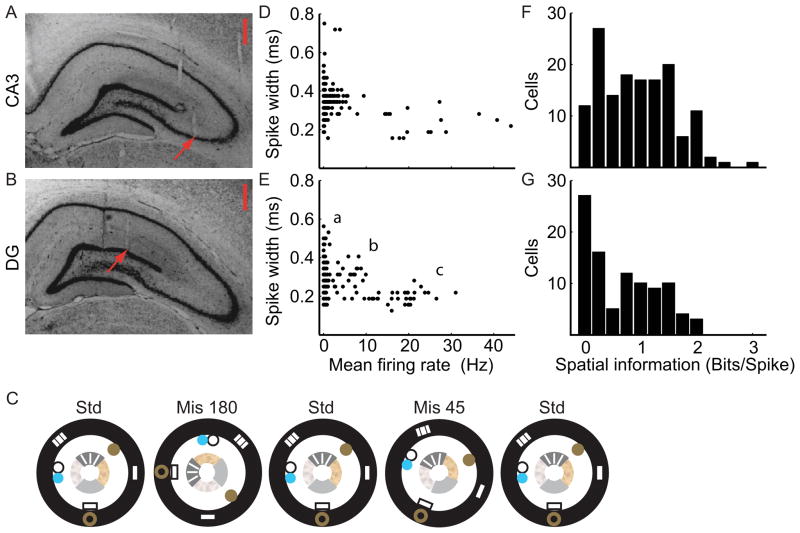
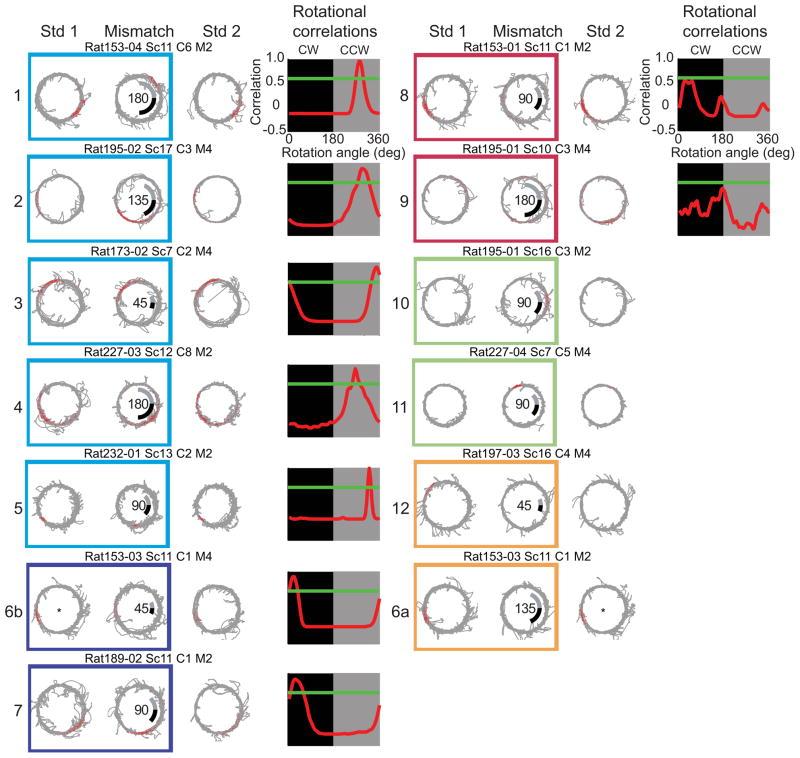
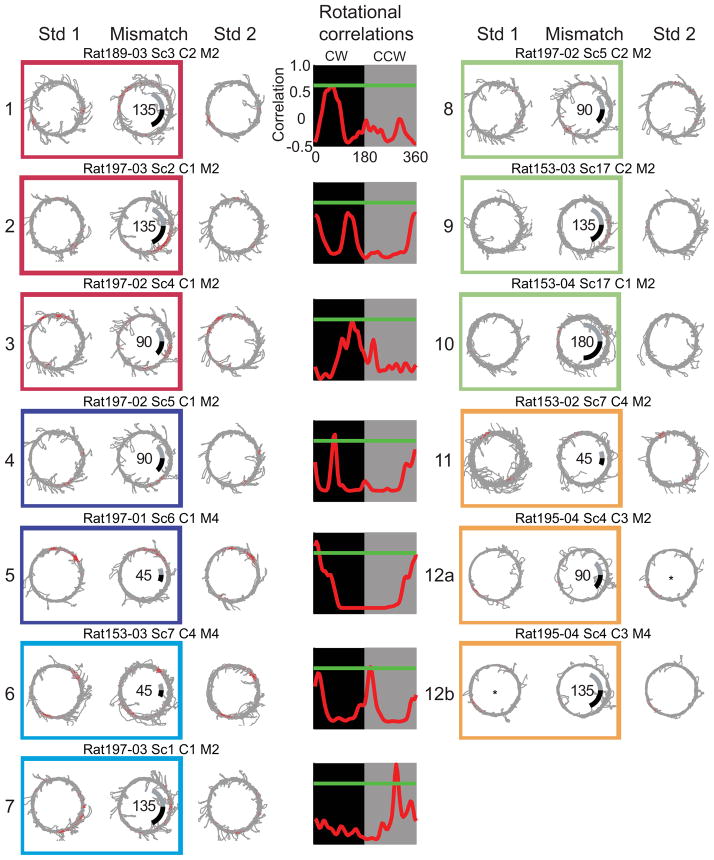
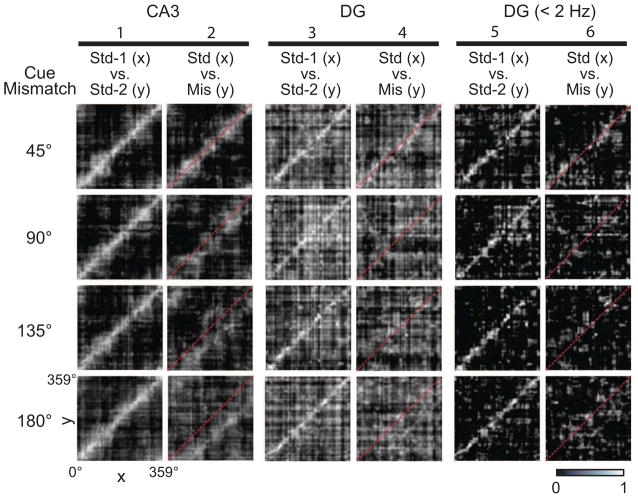
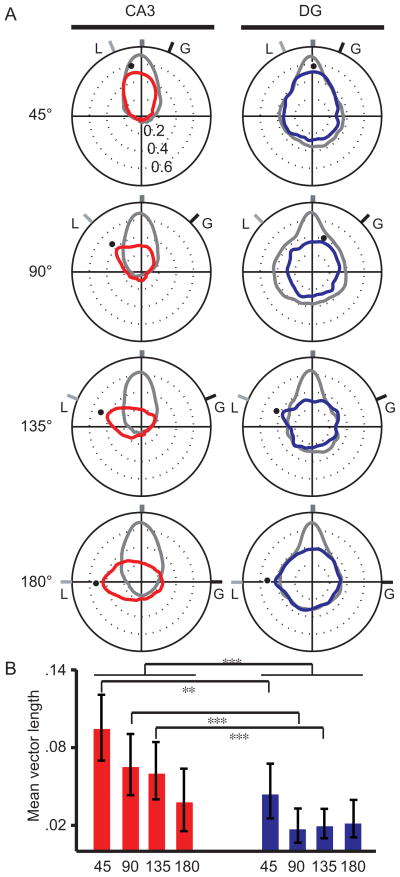
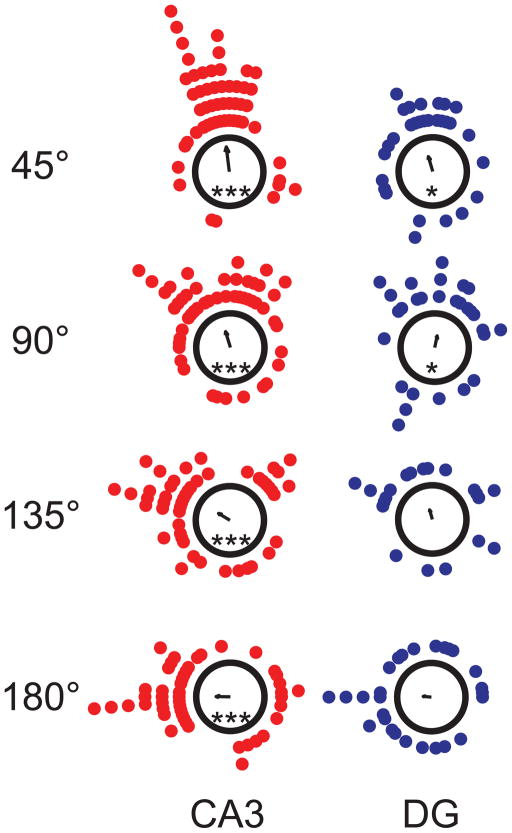
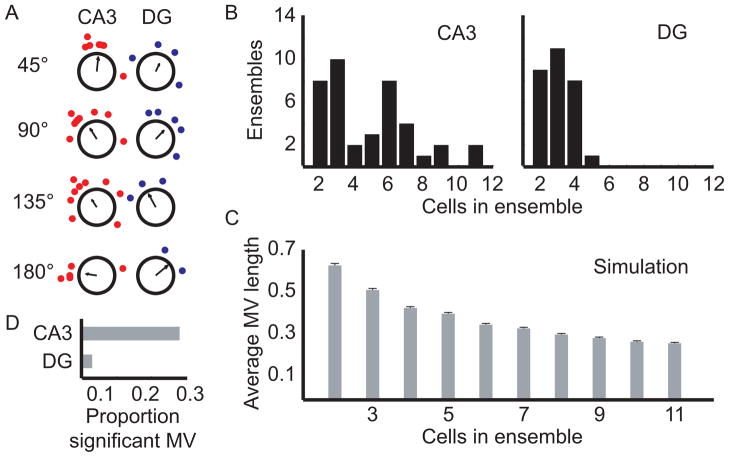
Theories of associative memory suggest that successful memory storage and recall depend on a balance between two complementary processes: pattern separation (to minimize interference) and pattern completion (to retrieve a memory when presented with partial or degraded input cues). Putative attractor circuitry in the hippocampal CA3 region is thought to be the final arbiter between these two processes. Here we present direct, quantitative evidence that CA3 produces an output pattern closer to the originally stored representation than its degraded input patterns from the dentate gyrus (DG). We simultaneously recorded activity from CA3 and DG of behaving rats when local and global reference frames were placed in conflict. CA3 showed a coherent population response to the conflict (pattern completion), even though its DG inputs were severely disrupted (pattern separation). The results thus confirm the hallmark predictions of a longstanding computational model of hippocampal memory processing.
Copyright © 2014 Elsevier Inc. All rights reserved.
Conflict of interest statement
The authors declare no competing financial interests.
Figures
Comment in
-
CA3 sees the big picture while dentate gyrus splits hairs.Neuron. 2014 Jan 22;81(2):226-8. doi: 10.1016/j.neuron.2014.01.004. Neuron. 2014. PMID: 24462091
Similar articles
-
CA3 sees the big picture while dentate gyrus splits hairs.Neuron. 2014 Jan 22;81(2):226-8. doi: 10.1016/j.neuron.2014.01.004. Neuron. 2014. PMID: 24462091
-
Neural Population Evidence of Functional Heterogeneity along the CA3 Transverse Axis: Pattern Completion versus Pattern Separation.Neuron. 2015 Sep 2;87(5):1093-105. doi: 10.1016/j.neuron.2015.07.012. Epub 2015 Aug 19. Neuron. 2015. PMID: 26298276 Free PMC article.
-
Pattern separation and completion of distinct axonal inputs transmitted via micro-tunnels between co-cultured hippocampal dentate, CA3, CA1 and entorhinal cortex networks.J Neural Eng. 2018 Aug;15(4):046009. doi: 10.1088/1741-2552/aabc20. Epub 2018 Apr 6. J Neural Eng. 2018. PMID: 29623900 Free PMC article.
-
Function of local circuits in the hippocampal dentate gyrus-CA3 system.Neurosci Res. 2019 Mar;140:43-52. doi: 10.1016/j.neures.2018.11.003. Epub 2018 Nov 5. Neurosci Res. 2019. PMID: 30408501 Review.
-
Corruption of the dentate gyrus by "dominant" granule cells: Implications for dentate gyrus function in health and disease.Neurobiol Learn Mem. 2016 Mar;129:69-82. doi: 10.1016/j.nlm.2015.09.005. Epub 2015 Sep 29. Neurobiol Learn Mem. 2016. PMID: 26391451 Free PMC article. Review.
Cited by
-
Statistical prediction of the future impairs episodic encoding of the present.Proc Natl Acad Sci U S A. 2020 Sep 15;117(37):22760-22770. doi: 10.1073/pnas.2013291117. Epub 2020 Aug 28. Proc Natl Acad Sci U S A. 2020. PMID: 32859755 Free PMC article.
-
Lifelong Learning of Spatiotemporal Representations With Dual-Memory Recurrent Self-Organization.Front Neurorobot. 2018 Nov 28;12:78. doi: 10.3389/fnbot.2018.00078. eCollection 2018. Front Neurorobot. 2018. PMID: 30546302 Free PMC article.
-
Differential responsivity of neurons in perirhinal cortex, lateral entorhinal cortex, and dentate gyrus during time-bridging learning.Hippocampus. 2019 Jun;29(6):511-526. doi: 10.1002/hipo.23041. Epub 2018 Nov 25. Hippocampus. 2019. PMID: 30311282 Free PMC article.
-
A Roadmap for Understanding Memory: Decomposing Cognitive Processes into Operations and Representations.eNeuro. 2019 Jul 10;6(4):ENEURO.0122-19.2019. doi: 10.1523/ENEURO.0122-19.2019. Print 2019 Jul/Aug. eNeuro. 2019. PMID: 31189554 Free PMC article. Review.
-
Early deficits in dentate circuit and behavioral pattern separation after concussive brain injury.Exp Neurol. 2023 Dec;370:114578. doi: 10.1016/j.expneurol.2023.114578. Epub 2023 Oct 18. Exp Neurol. 2023. PMID: 37858696 Free PMC article.
References
-
- Alme CB, Buzzetti RA, Marrone DF, Leutgeb JK, Chawla MK, Schaner MJ, Bohanick JD, Khoboko T, Leutgeb S, Moser EI, Moser MB, McNaughton BL, Barnes CA. Hippocampal granule cells opt for early retirement. Hippocampus. 2010;20:1109–1123. - PubMed
-
- Bonnevie T, Dunn B, Fyhn M, Hafting T, Derdikman D, Kubie JL, Roudi Y, Moser EI, Moser MB. Grid cells require excitatory drive from the hippocampus. Nat Neurosci. 2013;16:309–317. - PubMed
-
- Bragin A, Jando G, Nadasdy Z, van Landeghem M, Buzsaki G. Dentate EEG spikes and associated interneuronal population bursts in the hippocampal hilar region of the rat. J Neurophysiol. 1995b;73:1691–1705. - PubMed
Publication types
MeSH terms
Grants and funding
LinkOut - more resources
Full Text Sources
Other Literature Sources
Miscellaneous
