. 2014 Jan 22;81(2):438-51.
doi: 10.1016/j.neuron.2013.11.003.

Neural dynamics of reaching following incorrect or absent motor preparation

Affiliations

Neural dynamics of reaching following incorrect or absent motor preparation

K Cora Ames et al. Neuron. .

Abstract

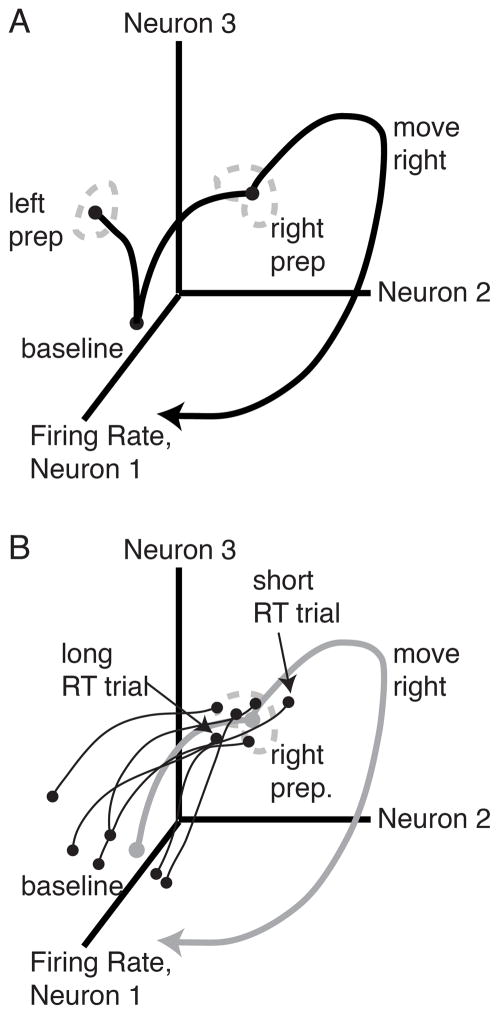
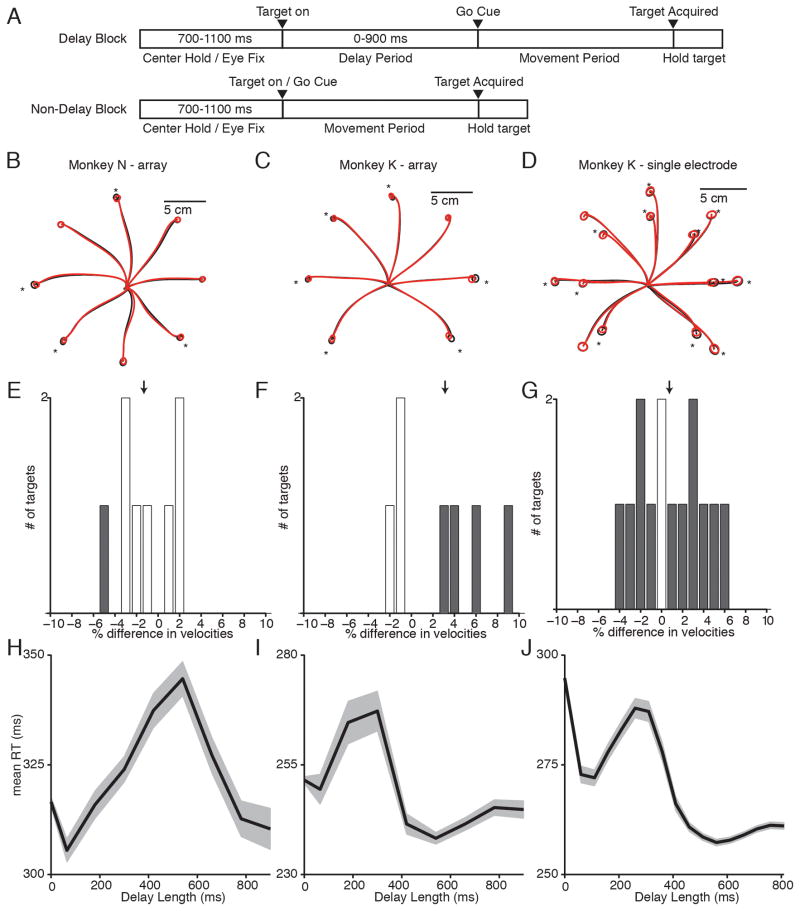
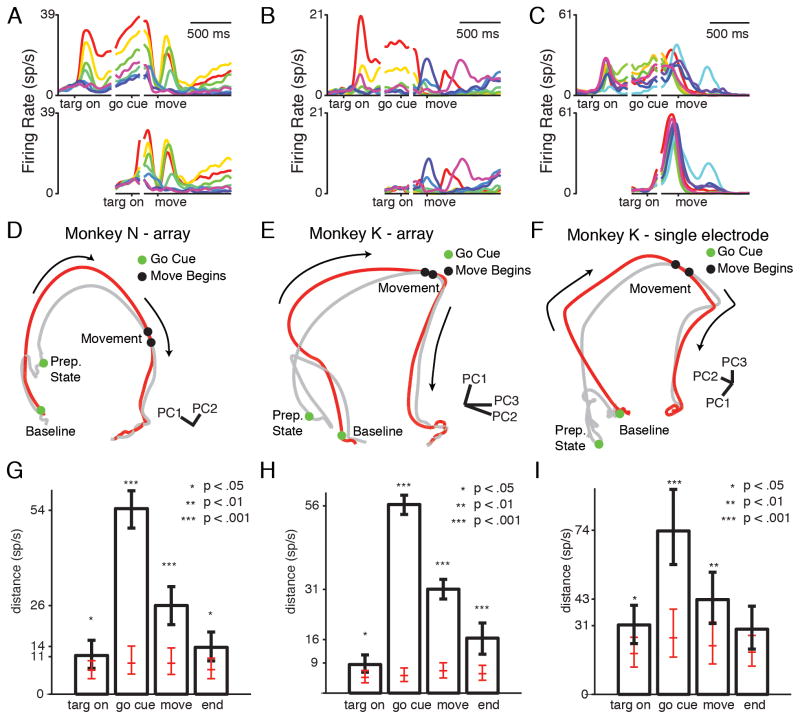
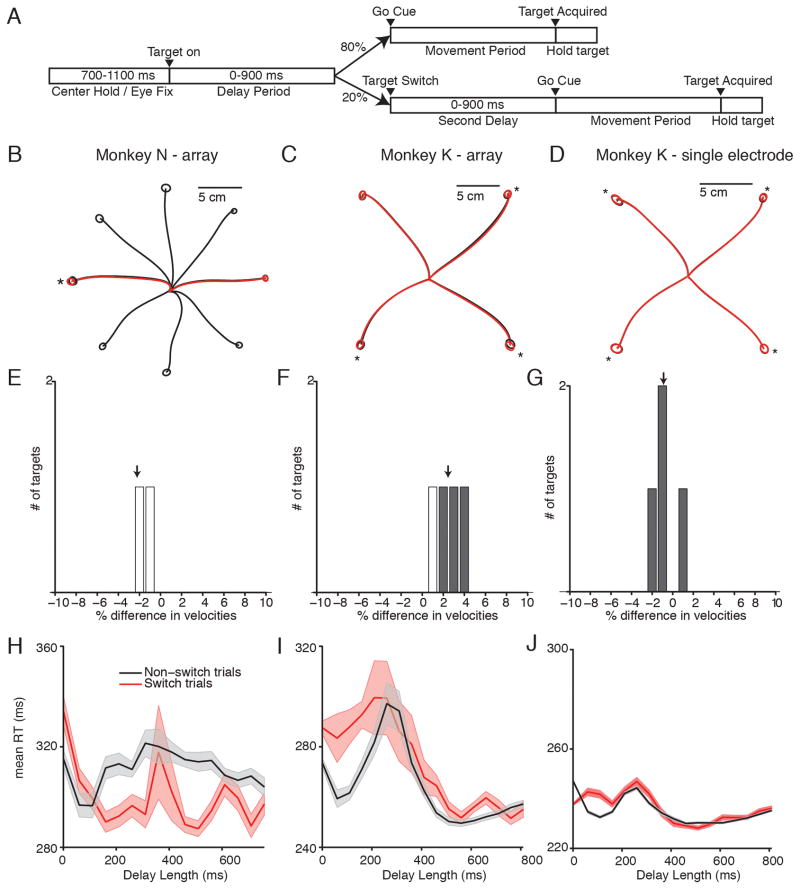
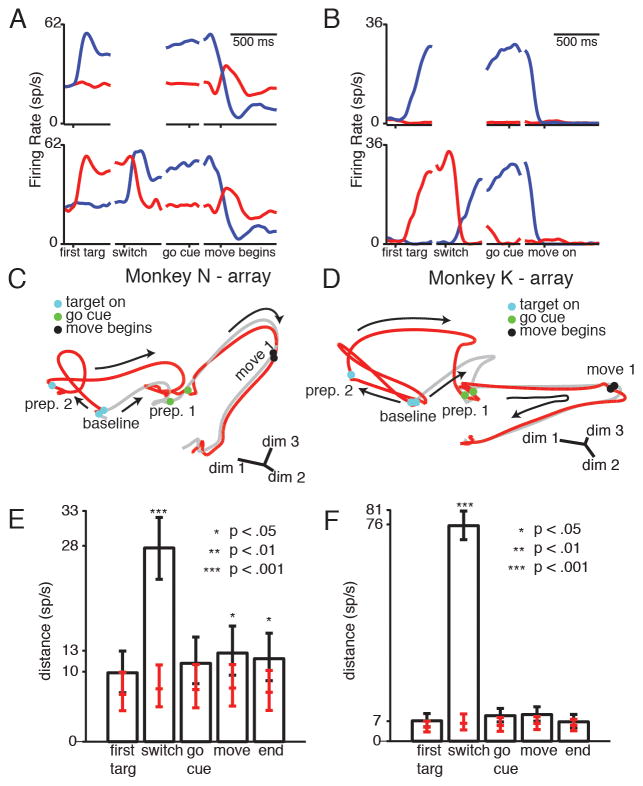
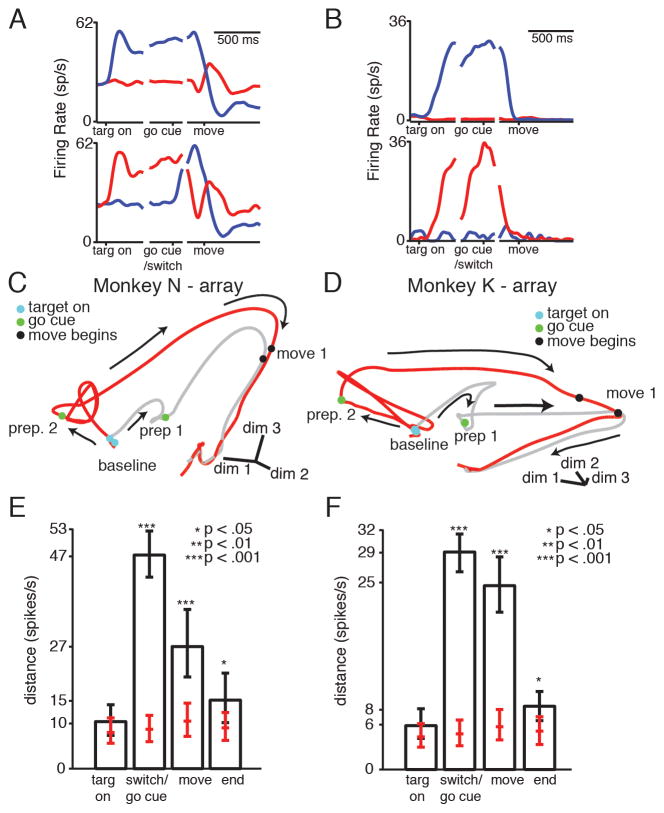
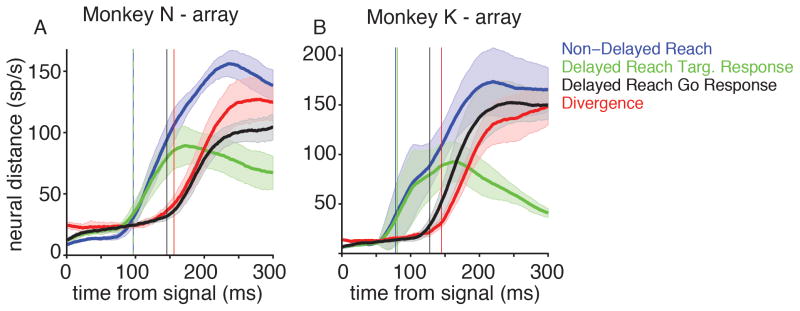
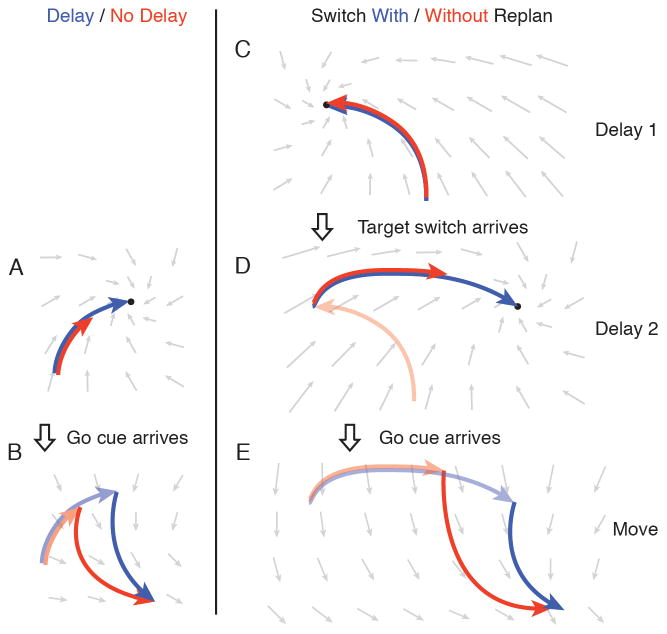
Moving is thought to take separate preparation and execution steps. During preparation, neural activity in primary motor and dorsal premotor cortices achieves a state specific to an upcoming action but movements are not performed until the execution phase. We investigated whether this preparatory state (more precisely, prepare-and-hold state) is required for movement execution using two complementary experiments. We compared monkeys' neural activity during delayed and nondelayed reaches and in a delayed reaching task in which the target switched locations on a small percentage of trials. Neural population activity bypassed the prepare-and-hold state both in the absence of a delay and if the wrong reach was prepared. However, the initial neural response to the target was similar across behavioral conditions. This suggests that the prepare-and-hold state can be bypassed if needed, but there is a short-latency preparatory step that is performed prior to movement even without a delay.


Figures

Figure 1
Figure 1
State-space cartoons. (A) Optimal subspace hypothesis. For each reach, there is a corresponding neural preparatory state. After the go cue, the neural population activity takes a trajectory that begins in the preparatory state and generates the prepared reach. (B) Initial condition hypothesis cartoon. Gray trace, mean neural population trajectory; black traces, individual trial neural population trajectories. When a reach is pre-cued, neural population trajectories on individual trials move to the preparatory state. On a each trial, the degree to which the neural state has advanced by the time of the go cue correlates with RT.
Figure 2
Figure 2
Behavior for delayed and non-delayed reaches. (A) Task design. Monkeys performed trials broken into blocks of delayed and non-delayed reaches. In the delayed reach block, a delay of 0–900 ms separated target onset and go cue. In the non-delayed reach block, the target onset and go cue were simultaneous. (B–D) Mean reach trajectories for delayed reaches (black) and non-delayed reaches (red). Circles show 1 STD of end point positions. Starred reaches show significantly different endpoint distributions (p<.05) (E–G) Differences in maximum reach velocity for each reach direction. Positive values indicate delayed reaches were faster than non-delayed reaches. Gray bars show significantly different reach velocities (p<.05). (H–J) Mean +/− SEM RT vs. delay length in 100-ms sliding bins.
Figure 3
Figure 3
Neural data for delayed and non-delayed reaches. (A–C) Example individual neural PSTHs. Each color represents a different reach direction. Top: conditions with a delay. Bottom: conditions without a delay. (A) Unit where delay activity is quickly recapitulated in the non-delay condition. (B) Unit whose delay activity is skipped in the non-delay condition. (C) Unit whose delay and non-delay activity has similar tuning but different magnitude. (D–F) Example neural state-space diagrams. Gray trace: delayed reach. Red trace: non-delayed reach. Arrows show direction of time. (G–I) Median resampled distance between trajectories at different times, for the trajectories pictured in D–F. Error bars show 5th and 95th percentile of the distribution. Red ticks: median, 5th, and 95th percentile of the distance detected if neural trajectories were generated from the same underlying distribution. Stars show bootstrap significance. See also Figure S1, Movie S1, Table S1.
Figure 4
Figure 4
Switch task behavior. (A) Task design. 80% of trials were delayed reaches. In 20% of trials, the initial target switched locations after 400 ms (N), 450 ms (K-single electrode) or 450–900 ms (K-array). The go cue either arrived immediately, or there was a second delay of 0–900 ms. (B–D) Mean reach trajectories for non-switch reaches (black) and switch reaches (red). Circles represent 1 STD of end point positions. Starred reaches show significantly different endpoint distributions (p<.05) (E–F) Difference in reach velocity between different reach directions. Positive indicates non-switch reaches were faster. Gray bars show significantly different reach velocities (p<.05). (G–H) Mean +/− SEM RT curves for non-switch (black) and switch (red) trials. In switch trials, delay length represents time from the target switch, rather than time from the initial target onset.
Figure 5
Figure 5
Neural activity for target switches followed by a second delay. (A–B) Example neural PSTHs. Traces are color coded by final reach direction. Top: conditions without a switch. Bottom: conditions with a switch. (C–D) Example state-space diagrams. Gray trace: non-switch condition. Red trace: switch condition. After the target switch, neural activity moves from prep state 2 to prep state 1, and then remains close to non-switch trajectory through the movement. (E–F) Median resampled distance between trajectories at different times, for the trajectories pictured in C–D. Error bars show 5th and 95th percentile of the distribution. Red ticks: median, 5th, and 95th percentile of the distance measured if neural trajectories were generated from the same underlying distribution. Stars show bootstrap significance. See also Figure S2, Movie S2, Table S2.
Figure 6
Figure 6
Neural activity for target switches with a simultaneous go cue. (A–B) Example neural PSTHs. Traces are colored by final reach direction. Top: non-switch conditions. Bottom: switch conditions. (A) Delay period activity is recapitulated after the go cue in the switch condition. (B) The preparatory state is not achieved after the go cue in the switch condition. (C–D) Example state-space diagrams. Gray trace: non-switch condition; red trace, switch condition. After the target switch, neural activity does not divert through the correct prepare-and-hold state, instead converging gradually with the non-switch movement trajectory (E–F) Median distance between trajectories at different times, for the trajectories pictured in C–D. Error bars show 5th and 95th percentile of the distribution. Red ticks: median, 5th, and 95th percentile of the distance measured if neural trajectories were generated from the same underlying distribution. Stars show bootstrap significance. See also Figure S3, Movie S3, Table S3.
Figure 7
Figure 7
Timing of neural responses to external cues. (A–B) Euclidean distance as a function of time from either the target or go cue (mean +/− STD across reach directions). Vertical lines show the time that the distance becomes greater than 20 sp/s (mean across reach directions). Green: Distance between delayed reach neural trajectories and baseline, as a function of time from target onset. Blue: Distance between non-delayed reach neural trajectories and baseline, as a function of time from target onset. Black: Distance between delayed reach neural trajectories and preparatory state, as a function of time from the go cue. Red: Distance between delayed reach neural trajectories and non-delayed reach neural trajectories, as a function of time from target onset. See also Figure S4.
Figure 8
Figure 8
Cartoon of preparation and movement dynamical systems. (A) When preparatory dynamics are engaged, neural activity approaches an attractor. Given a full delay (blue trace), neural activity reaches the attractor. Otherwise (red trace), neural activity approaches the attractor but may not converge. (B) The arrival of the go cue engages movement-generation dynamics. The neural state at the time of this transition (transparent red and blue traces) serves as the initial condition for the movement-generation neural trajectory (solid red and blue traces). (C) In target switch trials, neural activity moves to an attractor for the initially cued reach. (D) When the target switches, the attractor moves to a location corresponding to the preparatory state for the new target. If there is time, neural activity converges with this attractor (blue trace), otherwise approaches the attractor but may not converge (red trace). (E) The arrival of the go cue engages movement-generation dynamics. The neural state at the time of this transition serves as the initial condition for this new dynamical system.

References

    1. Afshar A, Santhanam G, Yu BM, Ryu SI, Sahani M, Shenoy KV. Single-Trial Neural Correlates of Arm Movement Preparation. Neuron. 2011;71(3):555–564. - PMC - PubMed
    1. Broome BM, Jayaraman V, Laurent G. Encoding and Decoding of Overlapping Odor Sequences. Neuron. 2006;51(4):467–482. - PubMed
    1. Bruce CJ, Goldberg ME. Primate frontal eye fields. I Single neurons discharging before saccades. J Neurophysiol. 1985;53:603–635. - PubMed
    1. Churchland MM, Shenoy KV. Delay of movement caused by disruption of cortical preparatory activity. J Neurophysiol. 2007;97(1):348–359. - PubMed
    1. Churchland MM, Afshar A, Shenoy KV. A central source of movement variability. Neuron. 2006a;52(6):1085–1096. - PMC - PubMed

Publication types

LinkOut - more resources