. 2014 Jan 30;156(3):428-39.
doi: 10.1016/j.cell.2013.12.015. Epub 2014 Jan 23.

Dividing cells regulate their lipid composition and localization

Affiliations

Dividing cells regulate their lipid composition and localization

G Ekin Atilla-Gokcumen et al. Cell. .

Abstract

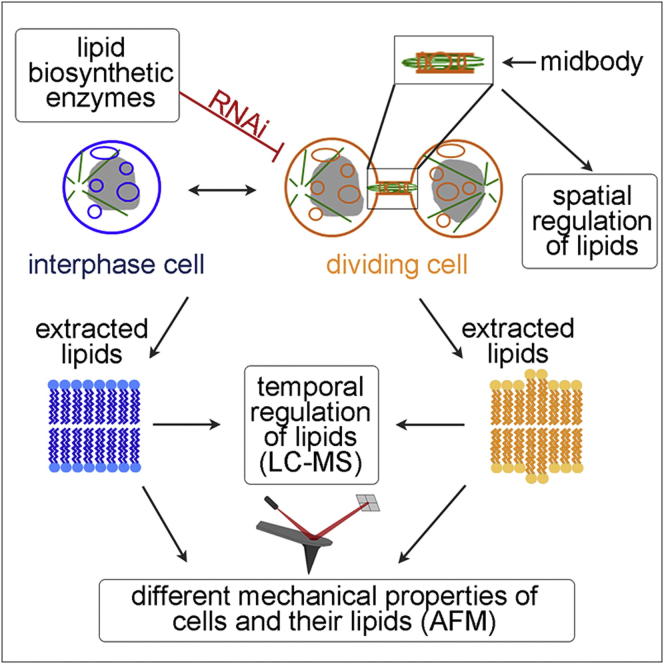
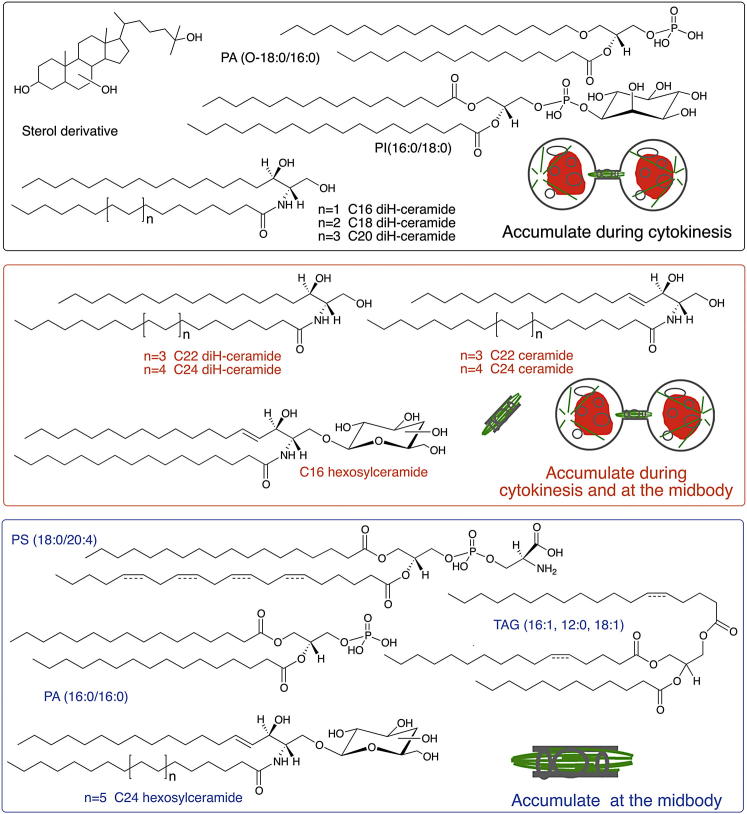
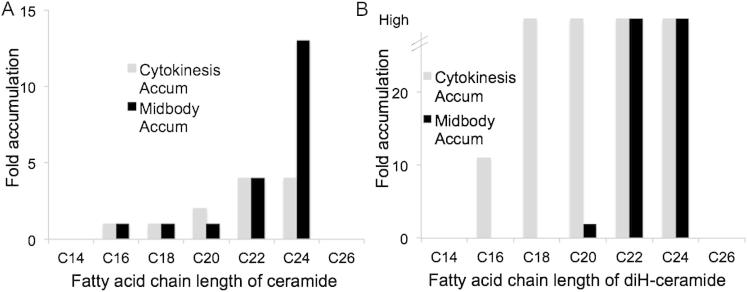
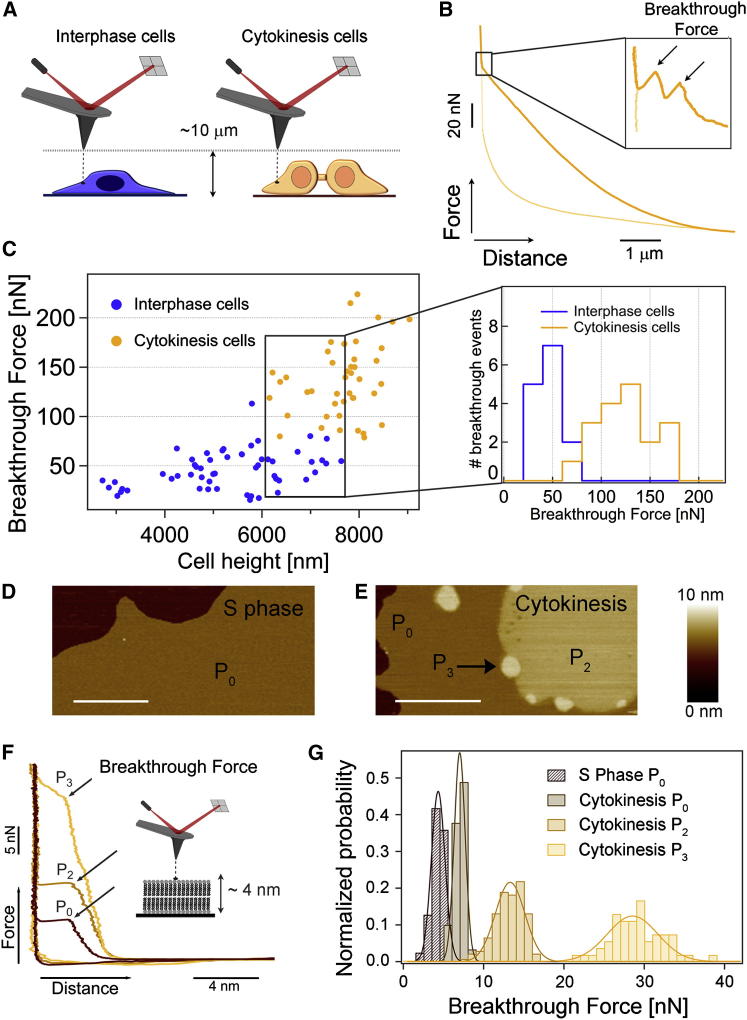
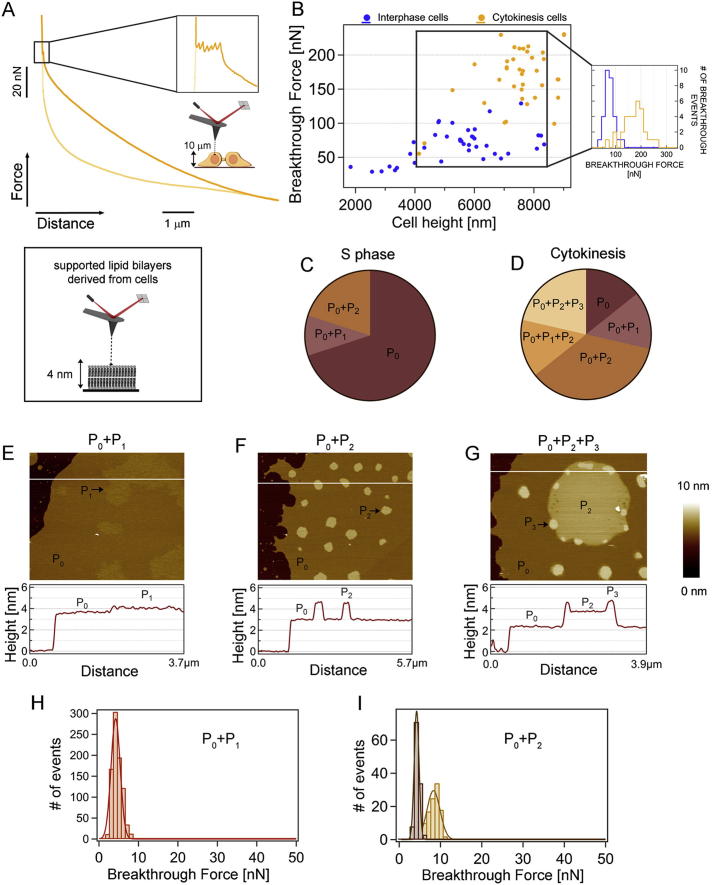
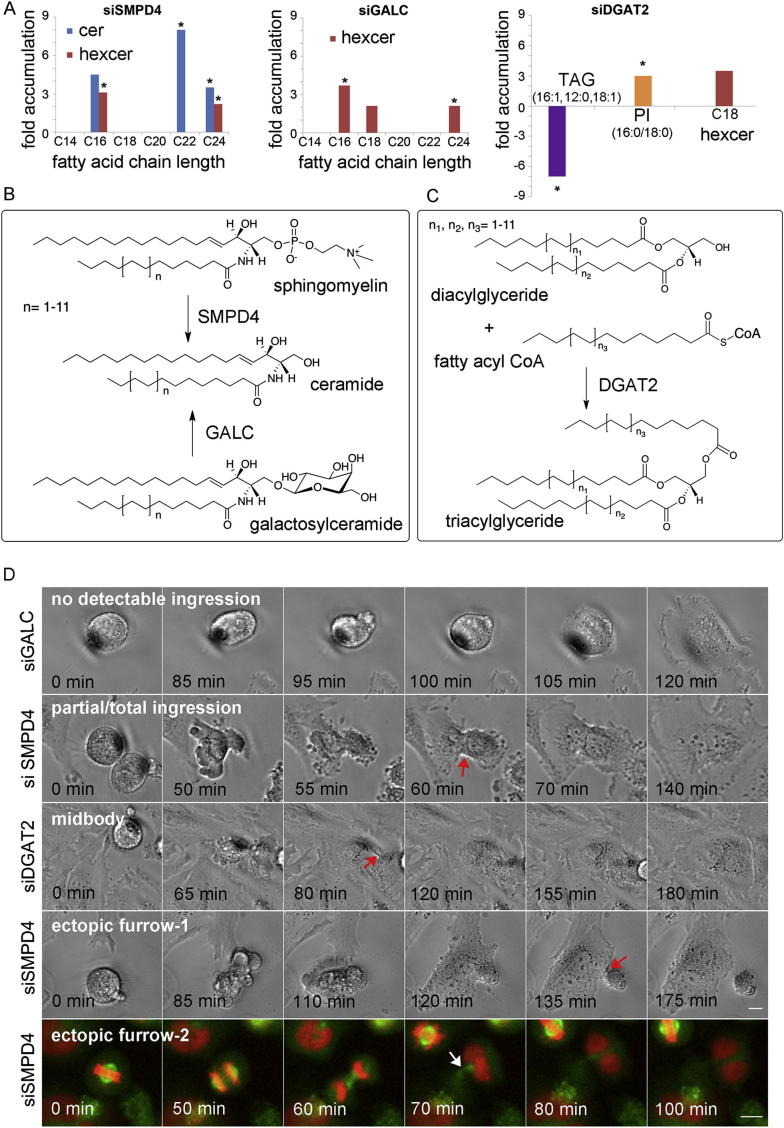
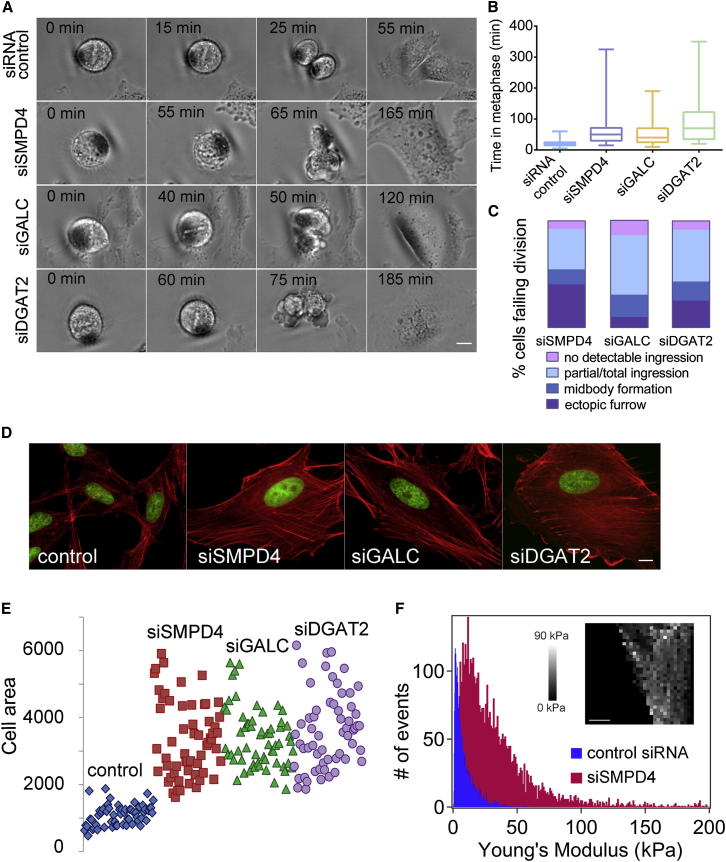
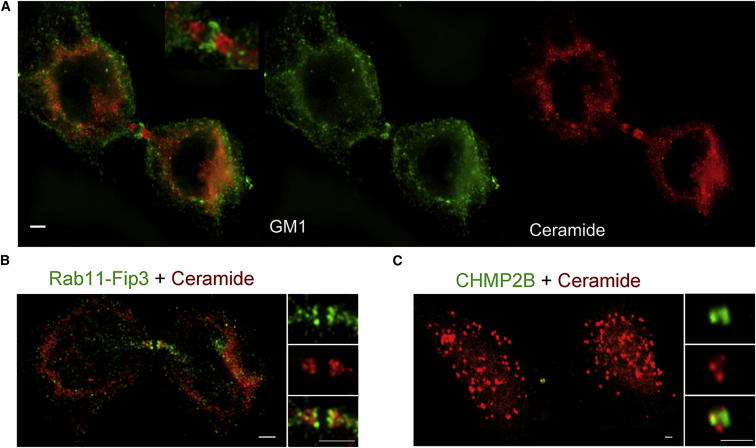
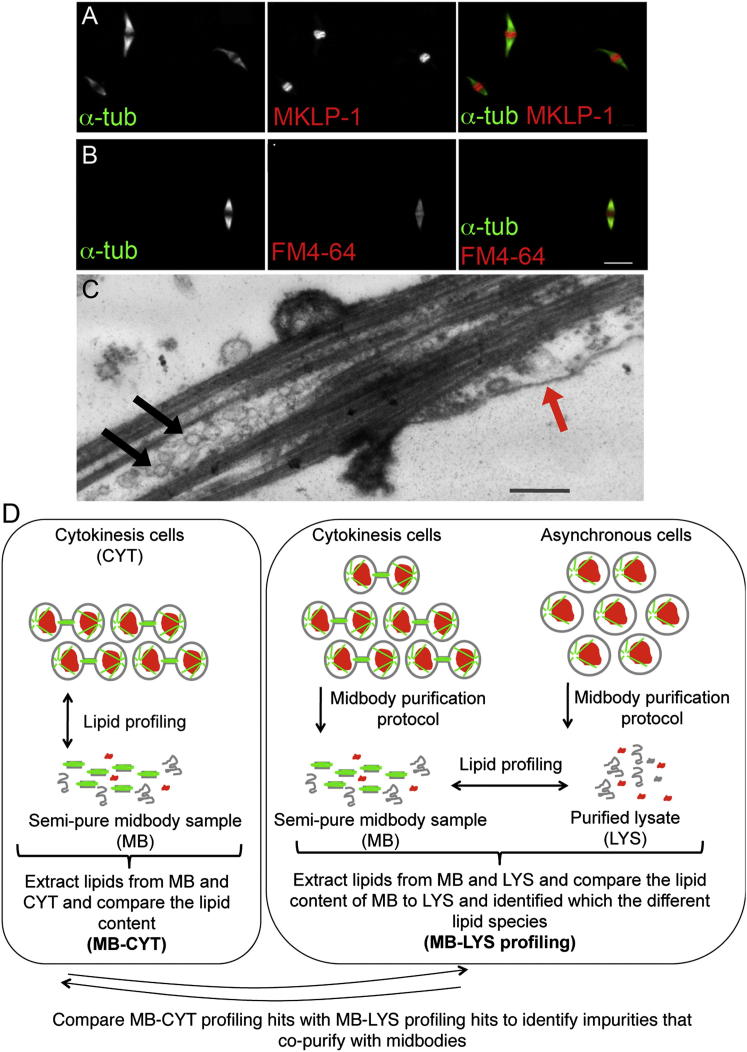
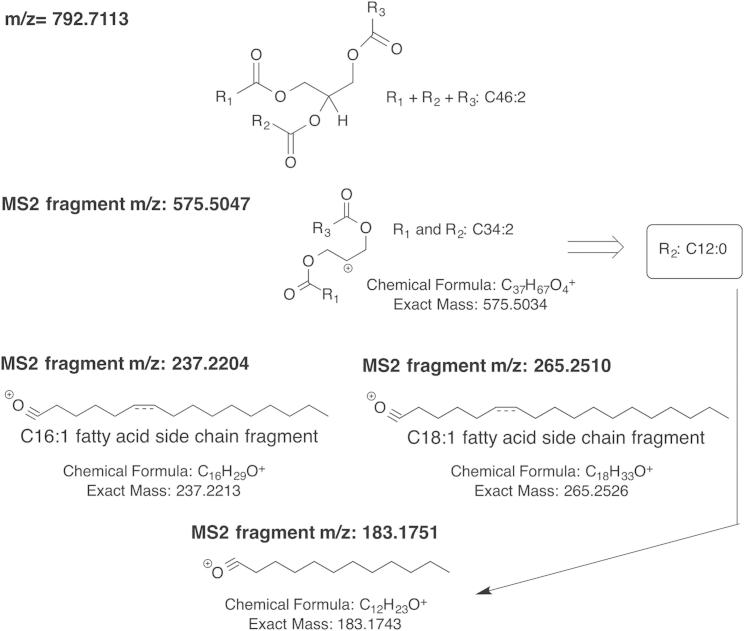
Although massive membrane rearrangements occur during cell division, little is known about specific roles that lipids might play in this process. We report that the lipidome changes with the cell cycle. LC-MS-based lipid profiling shows that 11 lipids with specific chemical structures accumulate in dividing cells. Using AFM, we demonstrate differences in the mechanical properties of live dividing cells and their isolated lipids relative to nondividing cells. In parallel, systematic RNAi knockdown of lipid biosynthetic enzymes identified enzymes required for division, which highly correlated with lipids accumulated in dividing cells. We show that cells specifically regulate the localization of lipids to midbodies, membrane-based structures where cleavage occurs. We conclude that cells actively regulate and modulate their lipid composition and localization during division, with both signaling and structural roles likely. This work has broader implications for the active and sustained participation of lipids in basic biology.


Figures

None
Graphical abstract
Figure 1
Figure 1
Chemical Structures of Lipids that Change during Cytokinesis and at the Midbody Chemical structures of the lipids listed in Table 1 are shown. Lipids that accumulate from S phase to cytokinesis are shown in black and red. Lipids that accumulate at the midbody are shown in red and blue. Note that the sn-1 and sn-3 positions and the positions of the double bonds in TAG (16:1, 12:0, 18:1) and PS (18:0/20:4) and the position of the third hydroxyl group on the B ring of the trihydroxycholestane could not be determined. Targeted MS analysis of the ceramide and diH-ceramide content of cytokinesis cells and midbodies is shown in Figure S1.
Figure S1
Figure S1
Targeted MS Analysis of the Ceramide and diH-Ceramide Content of Cytokinesis Cells and Midbodies, Related to Figure 1 (A) Fold changes of ceramide species with respect to the fatty acid chain length in cytokinesis cells (gray, compared to S phase cells) and at midbodies (black, compared to purified lysate). (B) Fold changes of diH-ceramide species with respect to the fatty acid chain length in cytokinesis cells (gray, compared to S phase cells) and at midbodies (black, compared to purified lysate).
Figure 2
Figure 2
The Mechanical Resistance of Cytokinesis-Associated Membranes Is Higher Both in Live Cells and in Supported Lipid Bilayers Measured In Vitro (A) Schematics of a force spectroscopy experiment on an interphase (nondividing) and cytokinesis (dividing) live cell. (B) Typical force-distance curve conducted on a live HeLa cell during cytokinesis. In a typical cycle, the cantilever tip approaches the cell membrane and applies an increasingly higher pushing force that deforms the cytoplasm. Once the cantilever reaches a position close to the stiff substrate, it is able to penetrate through the two lipid membranes. This breakthrough event is marked by two consecutive discontinuities in the force-extension trace (arrows in inset). The cantilever is then retracted to the initial position (light-yellow line). (C) Scatterplot of the first membrane breakthrough force versus the cell height for interphase (blue, 26 independent cells) and cytokinesis cells (yellow, 17 independent cells) in cytoplasmic areas. Similar experiments performed in the nuclear areas are shown in Figure S2. The plot shows that, although the breakthrough force increases with the cell height, dividing cells exhibit markedly higher breakthrough forces. Selecting a comparable range of cell heights (6–7.6 μm), the mechanical resistance of cytokinesis cells is significantly higher (inset in C, 125 ± 30 nN and 48 ± 14 nN breakthrough force for dividing and interphase cells, respectively) with >99.99% confidence (Student’s t test). Though the error in comparing values between dividing and nondividing cells is small, there is an additional potential error in the absolute values reported due to limitations in the size of the cantilevers available for these experiments (see Extended Experimental Procedures for a discussion). (D and E) Lipids derived from cells at S phase and cytokinesis form supported lipid individual bilayers that exhibit distinct morphologies as revealed by tapping mode AFM topographical images. (D) Supported lipid bilayers composed of S phase lipids exhibit a continuous P0 phase. (E) By contrast, in the case of lipids extracted from cytokinesis cells, three main phases of increasing height are observed (respectively, P0, P2, and P3). Scale bar, 1 μm. (F) Force-distance curves on both supported lipid bilayers revealed distinct mechanical stabilities. (G) The mechanical resistance of lipid bilayers formed from S phase cells (P0) yielded a mean breakthrough force of 3.87 ± 0.84 nN (n = 900), obtained by Gaussian fits to the data. In the case of the cytokinesis sample, both the P2 phase (12.93 ± 1.83 nN, n = 137) and the P3 phase (28.3 ± 3.17 nN, n = 54) revealed a much higher mechanical stability than the matrix bilayer phase, P0 (6.5 ± 0.68 nN, n = 90). Note that the nomenclature defining each of the phases is arbitrary yet consistent throughout the paper. For detailed descriptions of all phases and the height profile of (E), see Figure S2.
Figure S2
Figure S2
Cytokinesis Cells Exhibit Higher Mechanical Resistance Than Interphase Cells in Distinct Cellular Regions; High-Resolution AFM Images on Supported Lipid Bilayers Reveal a Complex Distribution of Phases, Related to Figure 2 (A) Typical force-distance curve conducted on a live dividing HeLa cell in the nuclear area. This event is distinguishable by six consecutive discontinuities corresponding to the breakthrough of the plasma membrane (two events) in addition to those of the nuclear envelope (composed by two lipid bilayers and therefore showing four breakthrough events). (B) Scatterplot of the upper membrane breakthrough force (first event) versus the cell height for interphase (blue) and cytokinesis cells (yellow) in the nuclear area (19 cells per case). As in the case of the cytoplasmic region, the breakthrough force steadily increases with the cell height. When selecting a comparable range of cell heights (4.1-8.3 μm), the mechanical resistance of the nuclear region in cytokinesis membranes is clearly higher (174 ± 42 nN, n = 34) than that of nondividing cells (76 ± 19 nN, n = 29) (inset in B) with a > 99.99% confidence (Student’s t test). (C–I) Supported lipid bilayers isolated from live cells and analyzed at high-spatial resolution by AFM imaging exhibit a complex distribution of phases and mechanical stabilities. While Figure 2 D–E reflects the most distinctive patterns of phase distribution in our supported lipid bilayer samples, in some of the preparations additional phase distributions were observed. (C) Pie chart corresponding to S phase preparations shows that, while samples showing only a P0 phase are predominant (Figure 2D), in some cases P0 is accompanied by P1 or P2 phases. Note that the nomenclature defining each of the phases is arbitrary, yet self-consistent throughout the paper. (D) In the case of lipid bilayers formed from cytokinesis cells, a wider combination of the four distinct observed phases is encountered, as shown in the pie chart. The very stiff P3 phase was never observed in lipid bilayers isolated from S phase cells. Each pie chart contains 10 and 14 sets of experiments for S phase and cytokinesis cells, respectively. Particularly interesting phase combinations that are not discussed in the main text for cytokinesis preparations are shown in E and F. (E) A P1 phase that is only slightly higher than the matrix P0 phase (<0.2 nm) and readily apparent in the phase channel (not shown). (H) Notably, there is no measurable difference in the mechanical stability of the P0 and P1 phases (3.7 ± 1.7 nN). (F) Another common combination of phases is observed in F, whereby only P0 and P2 phase coexist. In this case, the height of the P2 phase is significantly higher (>1.27 nm) than the matrix P0 phase. (I) The mechanical stability of the P2 phase is higher (8.0 ± 1.3 nN) than the P0 phase (3.7 ± 0.6 nN). A larger version of Figure 2E with the associated height profile is shown in G. In this case three main phases are observed: a first P0 phase exhibiting 2.86 ± 0.52 nm, a second phase (P2) showing a height of 4.13 ± 0.54 nm relative to the mica substrate, and a higher P3 phase, featuring 4.96 ± 0.16 nm. For S phase cells, an average height of 2.63 ± 0.72 nm is observed for the matrix, continuous P0 phase (ref. to Figure 2D, height profile not shown).
Figure S3
Figure S3
Targeted MS Analysis of Lipids Changed in Cells Treated with SMPD4, GALC, or DGAT2 siRNA, Proposed Reaction Scheme for These Enzymes, and Cell Division Failure Phenotypes for RNAi-Treated Cells, Related to Figure 3 (A) Fold changes in ceramides, diH-ceramides, hexosylceramides, sphingomyelins and the lipids that accumulate during cytokinesis and at the midbody in siSMPD4, siGALC and siDGAT2 treated cells were calculated. For siDGAT2 treated cells, fold changes of representative DAGs (ranging from 24:0 to 38:0 with different unsaturation states) and TAGs (ranging from 36:0 to 50:0 with different unsaturation states) were also calculated. Lipid species that were also accumulated in cytokinesis and/or midbodies are highlighted with an asterisk (). Ceramides (cer) and hexosylceramides (hexcer) with varying side chains are shown for SMPD4 and GALC. A full list of the targeted analysis of ceramides is shown in Table S3. (B and C) Proposed reaction schemes for SMPD4, GALC (B) and DGAT2 (C): SMPD4 and GALC catalyze the formation of ceramide from sphingomyelins and galactosylceramides, respectively. DGAT2 catalyzes the formation of triacylglycerides from diacylglycerides and fatty acyl coenzyme A (fatty acyl CoA) (Cases et al., 2001, Clarke et al., 2011, Lee et al., 2010, Wenger et al., 1997, Wu et al., 2010). (D) Representative still images from time-lapse movies of dividing cells for SMPD4, GALC and DGAT2 siRNA treatments illustrating the different mechanisms that trigger cell division failure in HeLa and HeLa GTRH (Green-Tubulin Red-Histone) cells (last row, ectopic furrow-2). From top to bottom: no detectable ingression (siSMPD4, siGALC and siDGAT2: 7.6%, 14% and 8.3%, respectively); partial/total ingression ( = no detectable formation of a midbody: siSMPD4, siGALC and siDGAT2: 38%, 55.5% and 48.6%, respectively); midbody ( = clear formation of a midbody, late cytokinesis defect: siSMPD4, siGALC and siDGAT2: 13.9%, 20.8% and 18.1%, respectively); ectopic furrows ( = formation of an ectopic furrow and abscission or refusion of a portion of cytoplasm without nucleus: siSMPD4, siGALC and siDGAT2: 40.5%, 9.7% and 25%, respectively). Respective distributions of the different mechanisms for every enzyme knockdown are shown in Figure 3C. Arrows (red and white) highlight the phenotype characterizing each mechanism. Two different examples are shown for the ectopic furrow, they differ in the position and the timing of the ectopic furrow formation and the size of the portion of cytoplasm without nucleus compared to the binucleated cell (grouped in the histogram in Figure 3C). Scale bars, 10 μm.
Figure 3
Figure 3
RNAi Knockdown of Lipid Biosynthetic Enzymes Causes Cell Division Defects and Cytoskeletal Changes in Interphase Cells (A) Still images from time-lapse movies of dividing cells for control, SMPD4, GALC, and DGAT2 siRNA treatments. Movies are available in the Supplemental Information. Scale bar, 10 μm. (B) Box plots of metaphase delays caused by siSMPD4, siGALC, and siDGAT2 treatments, respectively (average ± SEM), 58 ± 4.6, 56.5 ± 5.4, and 90.6 ± 9 min. The time in metaphase for all RNAi-treated cells was significantly higher than the control (20.4 ± 1 min) with a > 99.99% confidence (t test). A minimum of 70 cells from 3 independents experiments for each case were analyzed. (C) SMPD4, GALC, and DGAT2 siRNA treatments result in different cytokinesis failure phenotypes. Examples for each phenotype are shown in Figure S3D. Ectopic furrow refers to both successful and unsuccessful abscissions. A minimum of 70 cells from three independent experiments for each case were analyzed. (D–F) SMPD4, GALC, and DGAT2 siRNA treatments result in altered cell shape and actin morphology. (D) Representative images are shown for control and siRNA-treated cells. F-actin is shown in red (phalloidin staining) and DNA in green (DAPI staining). Scale bar, 10 μm. (E) Quantification of the cell area for control cells (1088 ± 39 μm2, average ± SEM) and different siRNA-treated cells (respectively, for siSMPD4, siGALC, and siDGAT2: 3331 ± 143, 3386 ± 113, and 3617 ± 144 μm2). The area was measured in at least 60 mononucleated cells per treatment and was significantly higher in all RNAi-treated cells compared to control, with a >99.99% confidence (t test). Targeted lipid analyses of the RNAi samples are reported in Table S3 and Figure S3A. (F) Histogram of cell stiffness (Young’s modulus values, see Extended Experimental Procedures) measured on control and SMPD4 siRNA-treated cells. A total number of 4,098 indentations (21 cells) and 4,314 indentations (18 cells) were performed on control siRNAi and siSMPD4-treated cells, respectively. The average value for siSMPD4 cells is significantly higher (35 ± 8.8 kPa, average ± SEM) than siRNA control cells (8.3 ± 1.9 kPa), with a >99.95% confidence. (Inset) Typical 32 × 32 force-volume map measured on a siSMPD4 cell. The topography of the force-volume corresponds to an arbitrary color scale of the Young’s Modulus. Scale bar, 10 μm.
Figure 4
Figure 4
Ceramide-Containing Vesicles Localize to the Midbody (A) Different lipids show differential localization to division sites. The glycosphingolipid GM1 (green, visualized by cholera toxin) and ceramide (red, pan-ceramide antibody staining) at the midbody are shown. Images are Z projections and were acquired with a N-SIM super-resolution microscope. Inset shows 2× zoom of the midbody area. Scale bar, 2 μm. (B and C) Ceramide antibody staining only partially overlaps with endosomal proteins known to be involved in cytokinesis: FIP3-RAB11 (B) and CHMP2B (C). The images are Z projections acquired with an N-SIM super-resolution microscope (B) and a confocal microscope (C). Scale bars, 2 μm.
Figure 5
Figure 5
Midbody and Membrane Markers Are Correctly Localized in Isolated Intact Midbodies (A and B) Isolated midbodies were stained with α-tubulin, MKLP-1, a marker for midbodies (A), and FM4-64, a membrane marker (B). Scale bar, 5 μm. (C) Representative electron micrograph shows an isolated midbody with intact membrane structures. Black arrows show vesicles inside, and red arrow shows plasma membrane that surrounds the midbody. Scale bar, 500 nm. (D) Schematic of the experiments that we conducted to exclude from our LC-MS analysis membrane impurities that copurify with midbodies. We obtained and compared the profiles of midbodies versus cytokinesis (MB-CYT) and midbody versus purified lysate (MB-LYS). The hits from MB-CYT and MB-LYS profiling were compared. MB-CYT hits were checked in MB-LYS profiling. Lipids that were unchanged in MB-LYS profiling (i.e., found in lysate from asynchronous cells in equal amounts) were eliminated, as they are most likely impurities that copurified in both samples. Membrane structures, microtubules, and DNA are cartooned in gray, green, and red, respectively.
Figure S4
Figure S4
Scheme Showing the Assignment of m/z = 792.7113 as TAG (16:1, 12:0, 18:1), Related to Experimental Procedures MS/MS spectra for m/z=792.7113 were collected and corresponding fragments were identified. The fragments that were used for characterization are shown above. According to the fragment pattern, m/z=792.7113 was identified as triacylglycerol (16:1, 12:0, 18:1).

Comment in

References

    1. Albertson R., Riggs B., Sullivan W. Membrane traffic: a driving force in cytokinesis. Trends Cell Biol. 2005;15:92–101. - PubMed
    1. Atilla-Gokcumen G.E., Castoreno A.B., Sasse S., Eggert U.S. Making the cut: the chemical biology of cytokinesis. ACS Chem. Biol. 2010;5:79–90. - PMC - PubMed
    1. Atilla-Gokcumen G.E., Bedigian A.V., Sasse S., Eggert U.S. Inhibition of glycosphingolipid biosynthesis induces cytokinesis failure. J. Am. Chem. Soc. 2011;133:10010–10013. - PMC - PubMed
    1. Bissig C., Gruenberg J. Lipid sorting and multivesicular endosome biogenesis. Cold Spring Harb. Perspect. Biol. 2013;5:a016816. - PMC - PubMed
    1. Braverman N.E., Moser A.B. Functions of plasmalogen lipids in health and disease. Biochim. Biophys. Acta. 2012;1822:1442–1452. - PubMed

Supplemental References

    1. Cases S., Stone S.J., Zhou P., Yen E., Tow B., Lardizabal K.D., Voelker T., Farese R.V., Jr. Cloning of DGAT2, a second mammalian diacylglycerol acyltransferase, and related family members. J. Biol. Chem. 2001;276:38870–38876. - PubMed
    1. Clarke C.J., Wu B.X., Hannun Y.A. The neutral sphingomyelinase family: identifying biochemical connections. Adv. Enzyme Regul. 2011;51:51–58. - PMC - PubMed
    1. Garcia-Manyes S., Oncins G., Sanz F. Effect of temperature on the nanomechanics of lipid bilayers studied by force spectroscopy. Biophys. J. 2005;89:4261–4274. - PMC - PubMed
    1. Ivanova P.T., Milne S.B., Forrester J.S., Brown H.A. LIPID arrays: new tools in the understanding of membrane dynamics and lipid signaling. Mol. Interv. 2004;4:86–96. - PubMed
    1. Kihara T., Yoshida T., Haghparast S.M.A., Miyake J. Elasticity Mapping Analysis of Apical Cell Periphery Actin Structures of Normal Fibroblasts and Cervical Cancer Cells. JASMI. 2013;3:124–129.

Publication types

MeSH terms

Substances