. 2014 Jan 30;156(3):495-509.
doi: 10.1016/j.cell.2014.01.008. Epub 2014 Jan 23.

Neonatal insulin action impairs hypothalamic neurocircuit formation in response to maternal high-fat feeding

Affiliations

Neonatal insulin action impairs hypothalamic neurocircuit formation in response to maternal high-fat feeding

Merly C Vogt et al. Cell. .

Abstract

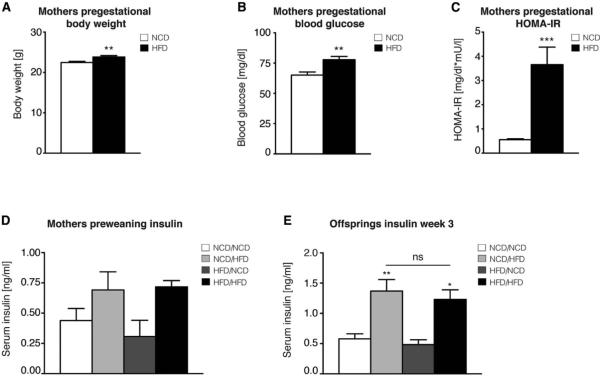
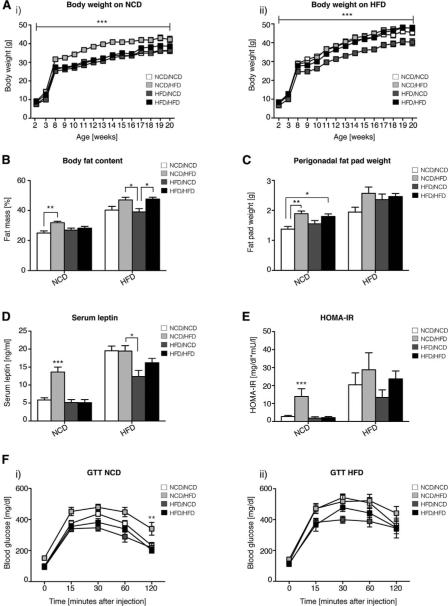
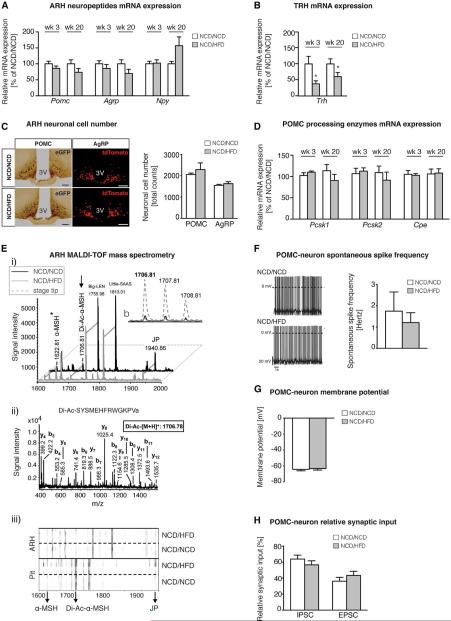
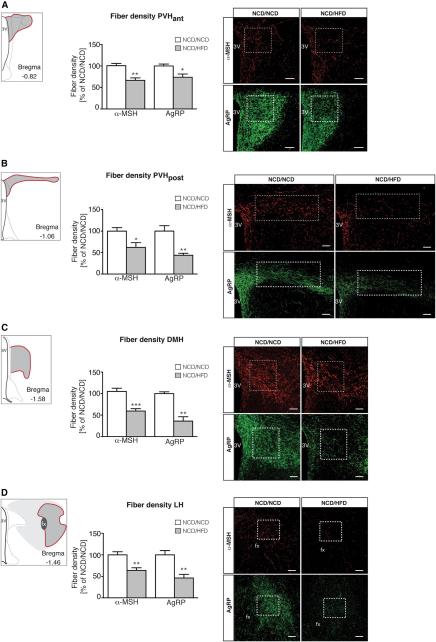
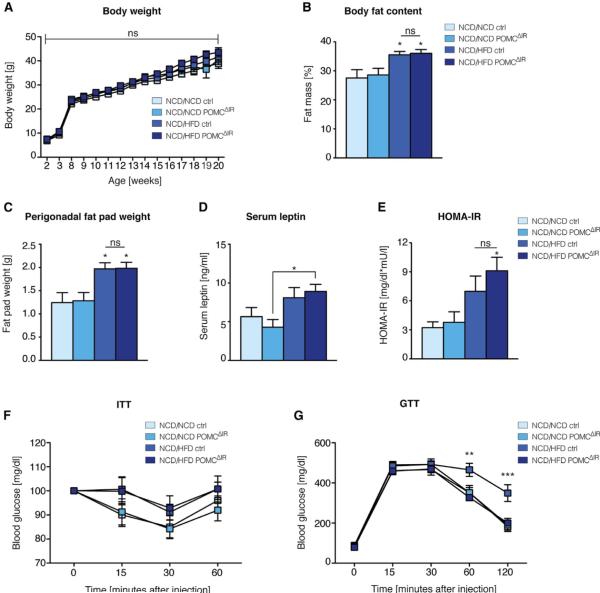
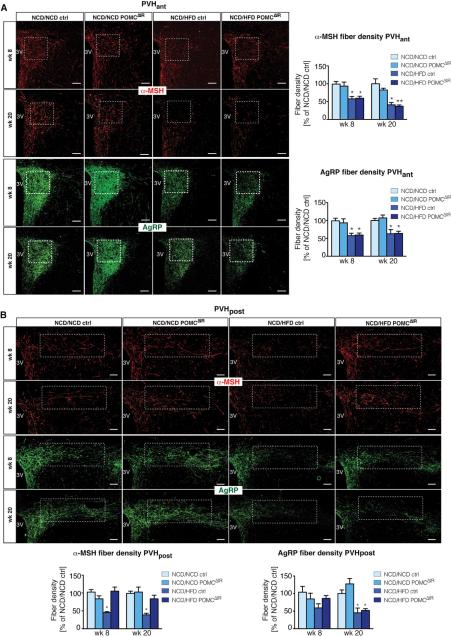
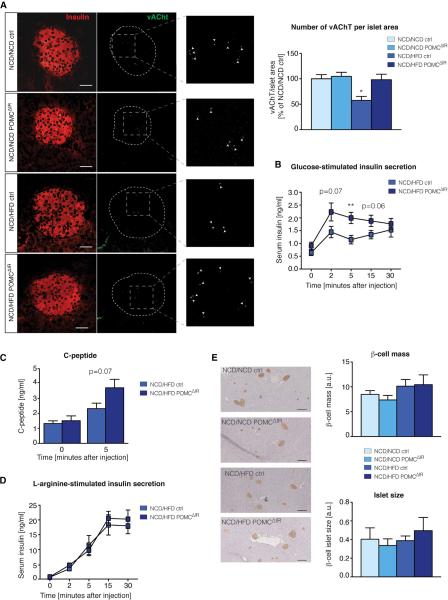
Maternal metabolic homeostasis exerts long-term effects on the offspring's health outcomes. Here, we demonstrate that maternal high-fat diet (HFD) feeding during lactation predisposes the offspring for obesity and impaired glucose homeostasis in mice, which is associated with an impairment of the hypothalamic melanocortin circuitry. Whereas the number and neuropeptide expression of anorexigenic proopiomelanocortin (POMC) and orexigenic agouti-related peptide (AgRP) neurons, electrophysiological properties of POMC neurons, and posttranslational processing of POMC remain unaffected in response to maternal HFD feeding during lactation, the formation of POMC and AgRP projections to hypothalamic target sites is severely impaired. Abrogating insulin action in POMC neurons of the offspring prevents altered POMC projections to the preautonomic paraventricular nucleus of the hypothalamus (PVH), pancreatic parasympathetic innervation, and impaired glucose-stimulated insulin secretion in response to maternal overnutrition. These experiments reveal a critical timing, when altered maternal metabolism disrupts metabolic homeostasis in the offspring via impairing neuronal projections, and show that abnormal insulin signaling contributes to this effect.


Figures

Figure 1
Figure 1. Maternal HFD-feeding induces pregestational metabolic abnormalities and hyperinsulinemia during lactation in the offspring
Maternal (A) pregestational body weight, (B) fasted blood glucose levels and (C) homeostatic model assessment indices of insulin resistance (HOMA-IR) (n=48vs50). (D) Maternal preweaning serum insulin levels in the fed state (n=4 for all groups). (E) Serum insulin levels in the offspring at 3 weeks of age (n=9 for all groups). NCD=normal chow diet, HFD=high fat diet. Data are presented as mean ± SEM, **p < 0.01, ***p < 0.001 versus all other groups within the same diet after week 8, if not indicated otherwise. See also Figure S1 for an overview of all experimental groups.
Figure 2
Figure 2. Maternal HFD-feeding exclusively during lactation predisposes the offspring for metabolic disorders
The following metabolic parameters were analyzed in all eight groups of male offspring. (A) Body weight on (i) normal chow diet (NCD; n=14vs10vs14vs13) or (ii) high fat diet (HFD; n=10vs8vs13vs12), (B) body fat content and (C) perigonadal fat pad weight at 20 weeks (nNCD=14vs10vs13vs12 and nHFD=10vs8vs12vs11), (D) fasted serum leptin levels and (E) homeostatic model assessment indices of insulin resistance (HOMA-IR) at 15 weeks (nNCD=13vs8vs11vs9 and nHFD=9vs8vs11vs11) and (F) glucose tolerance tests (GTT) at 15 weeks of age on i) NCD (n=13vs10vs14vs13) and ii) HFD (n=10vs8vs9vs12). Data are presented as mean ± SEM, *p < 0.05. **p < 0.01. ***p < 0.001 versus all other groups within the same diet after 8 weeks of age, unless otherwise indicated. See also Figure S2 for data on female offspring.
Figure 3
Figure 3. Effects of maternal HFD-feeding during lactation on hypothalamic neurocircuits
All following analyses were performed in NCD/NCD and NCD/HFD male offspring. Quantitative real-time PCR analysis of hypothalamic (A) pro-opiomelanocortin (Pomc), agouti-related peptide (Agrp) and neuropeptide Y (Npy) and (B) thyrotropin-releasing hormone (Trh) mRNA expression at 3 (n=9vs11) and 20 weeks (n=8vs9) of age on NCD. (C) Analysis of POMC (left) and AgRP (right) neurons in the arcuate nucleus of the hypothalamus (ARH) in POMCeGFP and AgRPtdTomato mice, respectively, at 8 weeks of age (nPOMC=3vs3 and nAgRP=4vs5; scale bar = 100 μm). (D) Quantitative real-time PCR analysis of hypothalamic proprotein convertase subtilisin/kexin type 1 (Pcsk1), proprotein convertase subtilisin/kexin type 2 (Pcsk2) and carboxypeptidase E (Cpe) mRNA expression at 3 (n=9vs11) and 20 weeks (n=8vs9) of age on NCD. (E) MALDITOF mass spectra obtained by profiling extracts of the ARH at 20 weeks of age (n=4vs4). Prominent ion signals are labeled. i) Comparison of mass fingerprints showing nearly identical ion signals, including ions that are mass-identical with products of the POMC precursor (α-MSH, Di-Ac-MSH, joining peptide (JP)). Fragmentation experiments confirmed the sequences of all labeled peptides; the ion-signal at 1622.81 (asterisk) is composed of two substances (including α-MSH). The arrow marks processed and biologically more potent di-acetylated α-MSH. b) Isotopic pattern and signal intensity of di-acetylated α-MSH before (lower traces) and after Stage Tip concentration. ii) MALDI-TOF/TOF fragment spectrum of di-acetylated α-MSH purified and concentrated with Stage Tips. Y- and b-type fragment ions are labelled, which confirmed the amino acid sequence of di-acetylated α-MSH. iii) Gel view of mass spectra (n=4 each) from preparation of ARH and pituitary gland (Pit) demonstrating identical processing of Pomc-products in all samples. (F) Spontaneous spike frequency and (G) membrane potential of POMCeGFP neurons obtained by perforated patch clamp recordings (n=13 neurons obtained from n=3 animals for each group). (H) Whole-cell recordings showing the relative synaptic input on POMCeGFP neurons (n=13vs14 neurons obtained from n=5vs8 mice). Data are presented as mean ± SEM, *p < 0.05 versus all other groups at the same age. See also Figure S3 for hypothalamic mRNA expression of inflammatory markers at 3 and 20 weeks of age.
Figure 4
Figure 4. Maternal HFD-feeding exclusively during lactation impairs axonal projections of ARH neurons to intrahypothalamic target sites
Images and quantification of α-melanocyte-stimulating hormone (α-MSH) and agouti-related peptide (AgRP) immunoreactive fibers innervating (A) the anterior endocrine paraventricular nucleus of the hypothalamus (PVHant; nα-MSH =6vs7 and nAgRP=7vs7), (B) the posterior preautonomic PVHpost (nα-MSH =5vs5 and nAgRP=4vs4), (C) the dorsomedial nucleus of the hypothalamus (DMH; nα-MSH =7vs7 and nAgRP=4vs5) and (D) the lateral hypothalamic area (LH; nα-MSH =6vs6 and nAgRP=6vs4) at 8 weeks of age. Schematics illustrating the localization in the CNS of the respective hypothalamic nuclei presented in the pictures were based on and modified from Brain Maps: Structure of the Rat Brain (Swanson, 1998). Coordinates were adapted according to the Mouse Brain in Stereotaxic Coordinates (Franklin and Paxinos, 1997). White boxes indicate area of quantification. 3V = third ventricle, fx = fornix. Scale bar = 100 μm. Data are presented as mean ± SEM, *p < 0.05. **p < 0.01 versus all other groups of offspring.
Figure 5
Figure 5. POMC-specific IR-deficiency does not protect from adiposity or insulin resistance, but improves glucose tolerance in NCD/HFD offspring
(A) Body weight (n=10vs13vs14vs14), (B) body fat content (n=9vs12vs14vs14) and (C) perigonadal fat pad weight (n=10vs12vs14vs14) at 20 weeks of age. (D) Fasted serum leptin levels (n=9vs9vs9vs14) and (E) homeostatic model assessment indices of insulin resistance (HOMA-IR; n=6vs10vs10vs14)) at 15 weeks, (F) insulin tolerance tests (ITT) at 14 weeks (n=16vs19vs20vs19) and glucose tolerance tests (GTT) at 15 weeks of age (n=10vs13vs13vs14). Data are presented as mean ± SEM, *p < 0.05. **p < 0.01. ***p < 0.001 versus all other groups of offspring, unless otherwise indicated. See also Figure S4 for data on milk composition.
Figure 6
Figure 6. POMC-specific IR-deficiency in NCD/HFD offspring rescues POMC axonal projections to preautonomic regions in the PVH
Images and quantification of α-melanocyte-stimulating hormone (α-MSH) and agouti-related-peptide (AgRP) immunoreactive fibers innervating (A) the anterior neuroendocrine paraventricular nucleus of the hypothalamus (PVHant) at 8 (nα-MSH and nAgRP =8vs8vs8vs10) and 20 weeks of age (n = 5 for all groups); and (B) the posterior preautonomic PVH (PVHpost) at 8 (nα-MSH =7vs6vs5vs6 and nAgRP=5vs6vs5vs6) and 20 weeks of age (n= 5 for all groups). White boxes indicate area of quantification. 3V= third ventricle. Scale bar = 100 μm. Data are presented as mean ± SEM, *p < 0.05 versus all other groups of offspring, unless otherwise indicated. See also S5 for images and quantification of α-MSH and AgRP immunoreactive fibers innervating the dorsomedial nucleus of the hypothalamus (DMH) and the lateral hypothalamic area (LH) at 20 weeks of age.
Figure 7
Figure 7. Effects of maternal HFD-feeding during lactation and POMC-specific IR-deficiency on pancreatic β-cells
(A) Images and quantification of the parasympathetic marker vesicular acetylcholine transporter (vAChT, green) on pancreatic β-cells (insulin, red) at 20 weeks of age (n=6vs5vs8vs6). Scale bar = 50 μm. (B) Glucose-stimulated insulin secretion (n=13vs13), (C) C-peptide levels 0 and 5 minutes after glucose injection (n=8vs8) (See also S6 for corresponding glucagon-like peptide 1 and free fatty acid concentrations), and (D) L-arginine-stimulated insulin secretion at 15 weeks of age (n=7vs7). (E) Images and quantification of total β-cell mass and average β-cell islet size at 20 weeks of age (n=6vs5vs4vs5). Scale bar = 300 μm. Data are presented as mean ± SEM, *p < 0.05 versus all other groups of offspring, unless otherwise indicated.

Comment in

References

    1. Anna V, van der Ploeg HP, Cheung NW, Huxley RR, Bauman AE. Sociodemographic Correlates of the Increasing Trend in Prevalence of Gestational Diabetes Mellitus in a Large Population of Women Between 1995 and 2005. Diabetes care. 2008;31:2288–2293. - PMC - PubMed
    1. Balthasar N, Coppari R, McMinn J, Liu SM, Lee CE, Tang V, Kenny CD, McGovern RA, Chua SC, Jr., Elmquist JK, et al. Leptin receptor signaling in POMC neurons is required for normal body weight homeostasis. Neuron. 2004;42:983–991. - PubMed
    1. Baum P, Petroff D, Classen J, Kiess W, Bluher S. Dysfunction of autonomic nervous system in childhood obesity: a cross-sectional study. PloS one. 2013;8:e54546. - PMC - PubMed
    1. Belgardt BF, Bruning JC. CNS leptin and insulin action in the control of energy homeostasis. Annals of the New York Academy of Sciences. 2010;1212:97–113. - PubMed
    1. Biag J, Huang Y, Gou L, Hintiryan H, Askarinam A, Hahn JD, Toga AW, Dong HW. Cyto- and chemoarchitecture of the hypothalamic paraventricular nucleus in the C57BL/6J male mouse: a study of immunostaining and multiple fluorescent tract tracing. The Journal of comparative neurology. 2012;520:6–33. - PMC - PubMed

Publication types

LinkOut - more resources