. 2014 Feb 13;6(3):421-30.
doi: 10.1016/j.celrep.2014.01.003. Epub 2014 Jan 23.

The cytosolic DNA sensor cGAS forms an oligomeric complex with DNA and undergoes switch-like conformational changes in the activation loop

Affiliations

The cytosolic DNA sensor cGAS forms an oligomeric complex with DNA and undergoes switch-like conformational changes in the activation loop

Xu Zhang et al. Cell Rep. .

Abstract

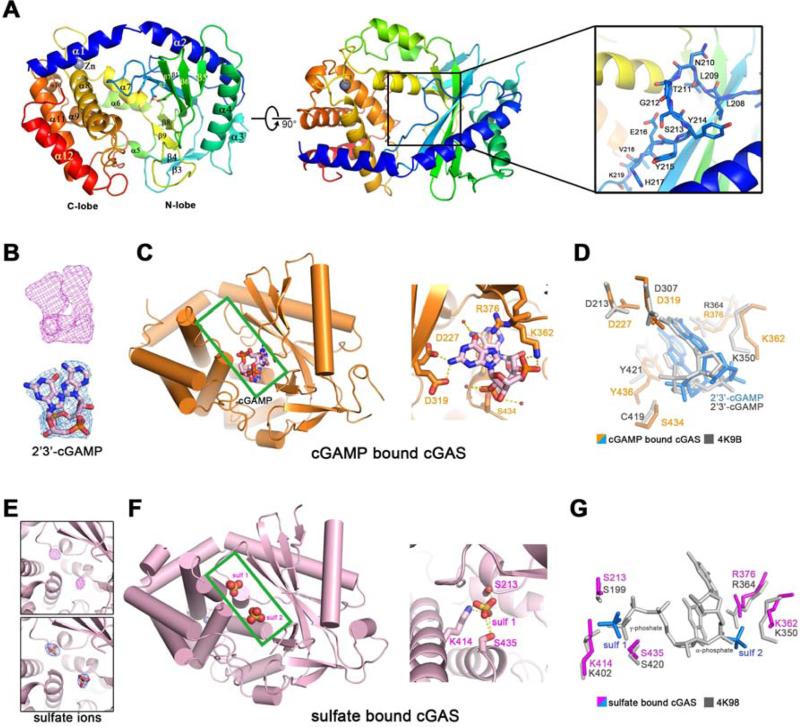
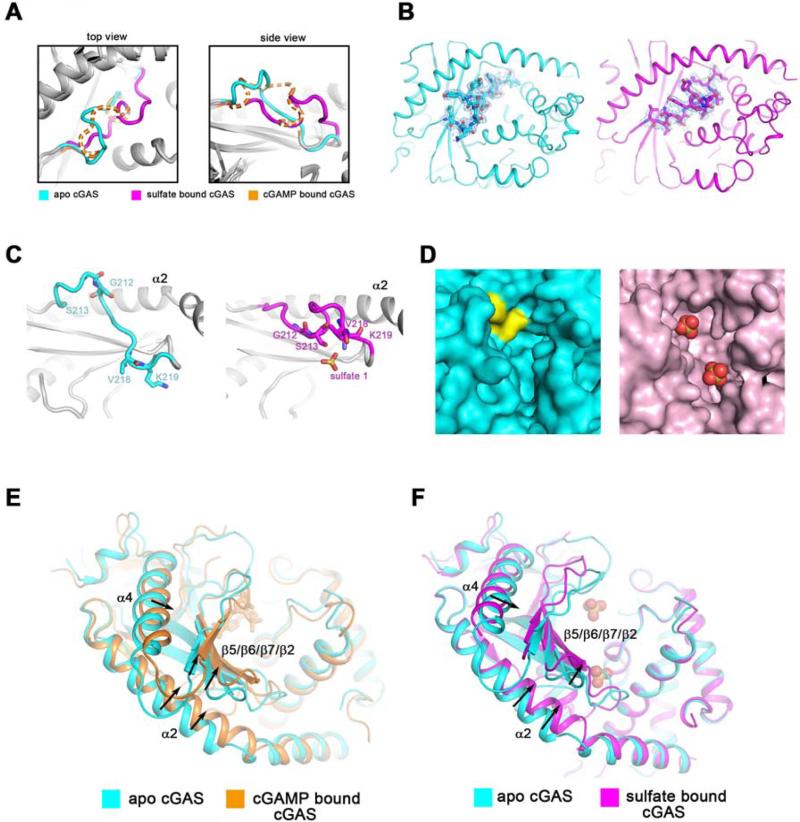
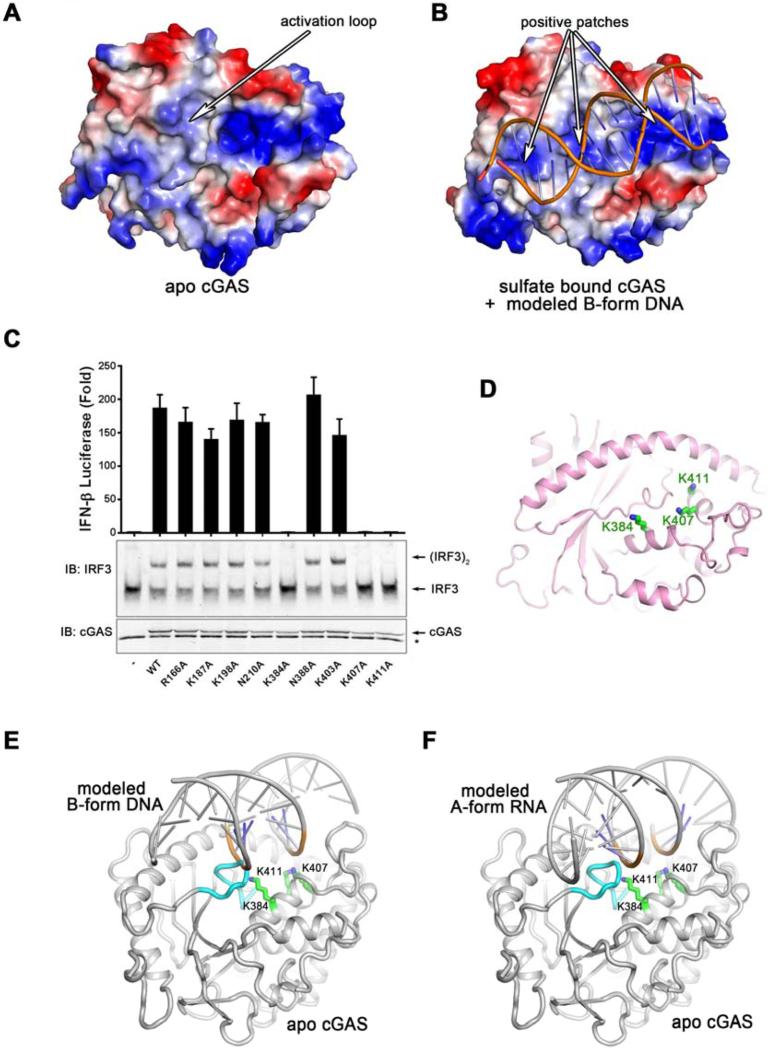
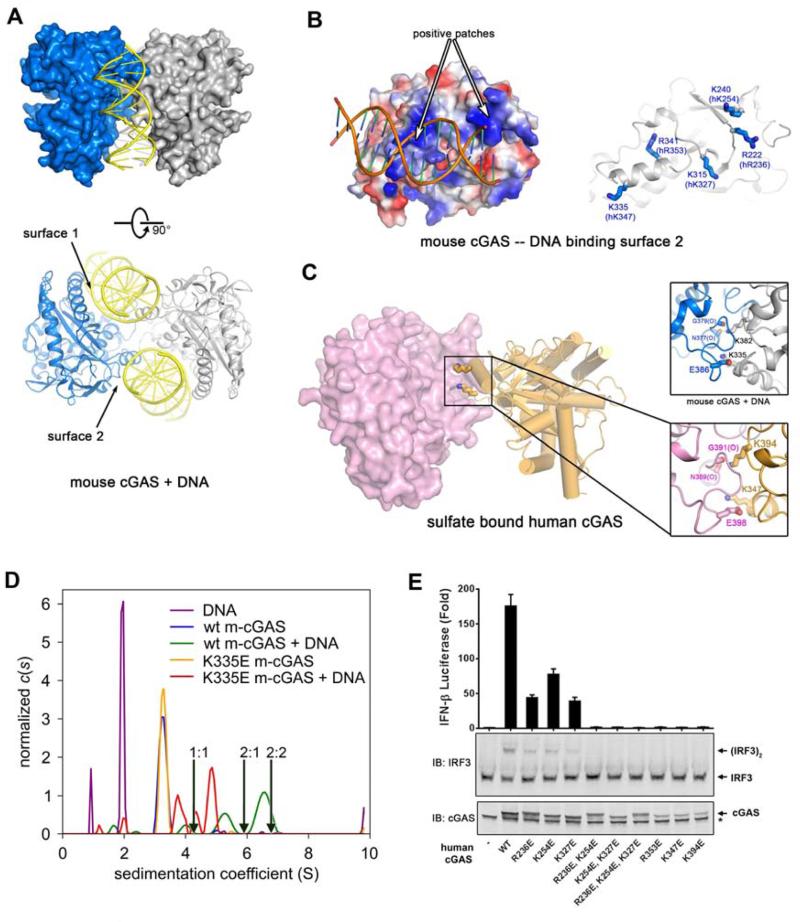
The presence of DNA in the cytoplasm is a danger signal that triggers immune and inflammatory responses. Cytosolic DNA binds to and activates cyclic GMP-AMP (cGAMP) synthase (cGAS), which produces the second messenger cGAMP. cGAMP binds to the adaptor protein STING and activates a signaling cascade that leads to the production of type I interferons and other cytokines. Here, we report the crystal structures of human cGAS in its apo form, representing its autoinhibited conformation as well as in its cGAMP- and sulfate-bound forms. These structures reveal switch-like conformational changes of an activation loop that result in the rearrangement of the catalytic site. The structure of DNA-bound cGAS reveals a complex composed of dimeric cGAS bound to two molecules of DNA. Functional analyses of cGAS mutants demonstrate that both the protein-protein interface and the two DNA binding surfaces are critical for cGAS activation. These results provide insights into the mechanism of DNA sensing by cGAS.


Figures

Figure 1
Figure 1. Overall structures of human cGAS in apo-form or in complex with 2’3’-cGAMP or sulfate ions
(A) Overall structure of human cGAS in the apo-form. The catalytic residues are shown in sticks. Two perpendicular views and a close-up view of the conserved loop connecting the first and second β strand are shown. The residues in the loop are shown in sticks. (B) The simulated annealing omit map (upper panel) and the 2Fo-Fc electron density map (lower pannel) for 2’3’-cGAMP are contoured at 3.0 σ and 1.0 σ, respectively. (C) Overall structure of cGAS in complex with 2’3’-cGAMP (left panel). The cleft between N-lobe and C-lobe is highlighted by green rectangle. 2’3’-cGAMP binds to cGAS by multiple polar contacts (right panel). (D) Residues involved in 2’3’-cGAMP binding are identical to the ones in mouse-cGAS-DNA-2’3’-cGAMP ternary complex (PDB: 4K9B). (E) The simulated annealing omit map (upper panel) and the 2Fo-Fc electron density map (lower panel) for the sulfate ion are contoured at 4.0 σ and 1.5 σ, respectively. (F) Overall structure of cGAS in complex with sulfate ions (left panel). The cleft between N-lobe and C-lobe is highlighted by green rectangle. Sulfate ion 1 is coordinated by several polar residues (right panel). (G) Residues involved in sulfate ion binding are conserved in mouse-cGAS-DNA-linear-2’-GTP-GMP ternary complex (PDB: 4K98). The position of sulfate ion 1 is similar to the γ-phosphate group of GTP moiety, whereas the position of sulfate ion 2 is similar to the α-phosphate group of GMP moiety. All the structure figures are prepared in PyMol (DeLano, 2002).
Figure 2
Figure 2. Ligand-induced conformational changes of the activation loop and active site rearrangement of cGAS
(A) Comparison of the activation loops in apo cGAS (cyan), sulfate bound cGAS (magenta), and cGAMP bound cGAS (orange). The loop of cGAMP bound cGAS is shown in dash line because of its high flexibility. Two perpendicular views are shown. The same color scheme is applied unless indicated otherwise. (B) The 2Fo-Fc electron density maps of the activation loop in apo cGAS (left panel) or sulfate bound cGAS (right panel), shown in blue mesh, are contoured at 0.8 σ. (C) The activation loop undergoes significant conformational changes in the presence of sulfate ions (right panel) when compared to apo-cGAS (left panel). α2 helix is used as the reference. (D) Val218 and Lys219 (colored in yellow) occupy a large part of the cleft between N-lobe and C-lobe in apo cGAS. The sulfate ions are shown in red spheres in the right panel. (E and F) The N lobe of cGAS exhibits distinguishable conformational shifts in the presence of 2’3’-cGAMP (E) or sulfate ions (F), as compared to the apo form.
Figure 3
Figure 3. The primary DNA-binding surface of cGAS is essential for IFNβ induction
(A and B) The electrostatic representations of apo cGAS (A) and sulfate bound cGAS (B). A series of positively charged patches in sulfate bound cGAS indicate the potential primary DNA binding surface. (C) Expression plasmids encoding WT and various mutants of human cGAS fragments (161-522) containing alanine substitutions of positively charged residues shown in (B) were transfected into HEK293T-STING-IFNβ luciferase reporter cells followed by luciferase assays to measure IFNβ induction. Aliquots of the cell extracts were immunoblotted with an IRF3 antibody following native gel electrophoresis (middle panel) or with a cGAS antibody flowing SDS-PAGE (bottom panel). The error bars represent variation ranges of duplicate experiments. (D) Functionally important positively charged residues, shown in green sticks, are located in the center of the primary binding surface. (E and F) Docking B-form DNA to apo cGAS (E) results in a steric clash between the activation loop and the DNA, which likely triggers the inward movement of the activation loop (E). However, docking A-form RNA to apo cGAS does not reveal the steric clash or the movement of the activation loop (F). The activation loop is colored in cyan. Loss-of-function mutations on the primary DNA binding surface are shown in sticks and colored in green.
Figure 4
Figure 4. cGAS forms a functional 2:2 complex with DNA
(A) Crystal structure of mouse cGAS in complex with a 16 bp dsDNA. Each asymmetric unit contains one 2:2 complex, composed of two protein molecules and two DNA molecules. Two perpendicular views are shown. (B) The electrostatic representations of DNA binding surface 2 of mouse cGAS (left). Conserved positively charged residues are shown on the right. with the corresponding residues in human cGAS shown in parentheses. (C) Sulfate bound human cGAS forms a dimer in the crystal (left); residues involved in the dimer interface of this structure (lower right panel) are identical to the ones in mouse cGAS-DNA complex (upper right panel). (D) Analytical ultracentrifugation of m-cGAS and DNA. Shown are c(s) distributions for various combinations of wild-type (“wt”) or K335E m-cGAS in the presence or absence of DNA. A distribution for DNA alone is also shown. The concentrations used were: DNA alone, 120 μM; wt m-cGAS, 80 μM; wt m-cGAS/DNA, 80 and 120 μM, respectively; K335E m-cGAS, 94 μM; K335E m-cGAS/DNA, 94 μM and 120 μM, respectively. All of the distributions have been normalized by the total interference signal (in fringes) present in the respective experiments. The arrows show the theoretical sedimentation coefficients of 1:1, 2:1, and 2:2 protein/DNA complexes. (E) The second DNA binding surface and the protein-protein interface are important for cGAS activity. Expression vectors encoding WT or mutant human cGAS proteins as indicated were transfected into HEK293T-STING-IFNβ luciferase reporter cells, followed by measurement of luciferase activities (upper panel). Aliquots of the cell extracts were immunoblotted with an IRF3 antibody following native gel electrophoresis (middle panel) or with a cGAS antibody flowing SDS-PAGE (lower panel).

References

    1. Ablasser A, Goldeck M, Cavlar T, Deimling T, Witte G, Rohl I, Hopfner KP, Ludwig J, Hornung V. cGAS produces a 2'-5'-linked cyclic dinucleotide second messenger that activates STING. Nature. 2013 - PMC - PubMed
    1. Balbo A, Minor KH, Velikovsky CA, Mariuzza RA, Peterson CB, Schuck P. Studying multiprotein complexes by multisignal sedimentation velocity analytical ultracentrifugation. Proc Natl Acad Sci U S A. 2005;102:81–86. - PMC - PubMed
    1. Barber GN. Cytoplasmic DNA innate immune pathways. Immunol Rev. 2011;243:99–108. - PubMed
    1. Civril F, Deimling T, de Oliveira Mann CC, Ablasser A, Moldt M, Witte G, Hornung V, Hopfner KP. Structural mechanism of cytosolic DNA sensing by cGAS. Nature. 2013;498:332–337. - PMC - PubMed
    1. DeLano WL. The PyMOL Molecular Graphics System. 2002 on World Wide Web http://wwwpymolorg.

Publication types