. 2014 Feb 13;6(3):514-27.
doi: 10.1016/j.celrep.2013.12.041. Epub 2014 Jan 23.

Inference of tumor evolution during chemotherapy by computational modeling and in situ analysis of genetic and phenotypic cellular diversity

Affiliations

Inference of tumor evolution during chemotherapy by computational modeling and in situ analysis of genetic and phenotypic cellular diversity

Vanessa Almendro et al. Cell Rep. .

Abstract

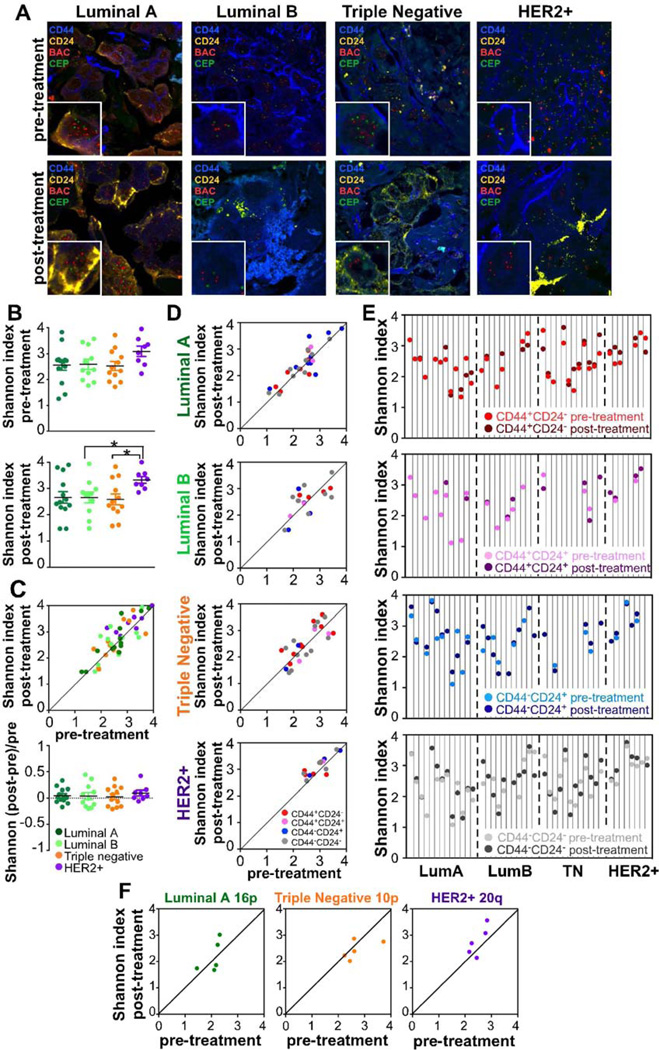
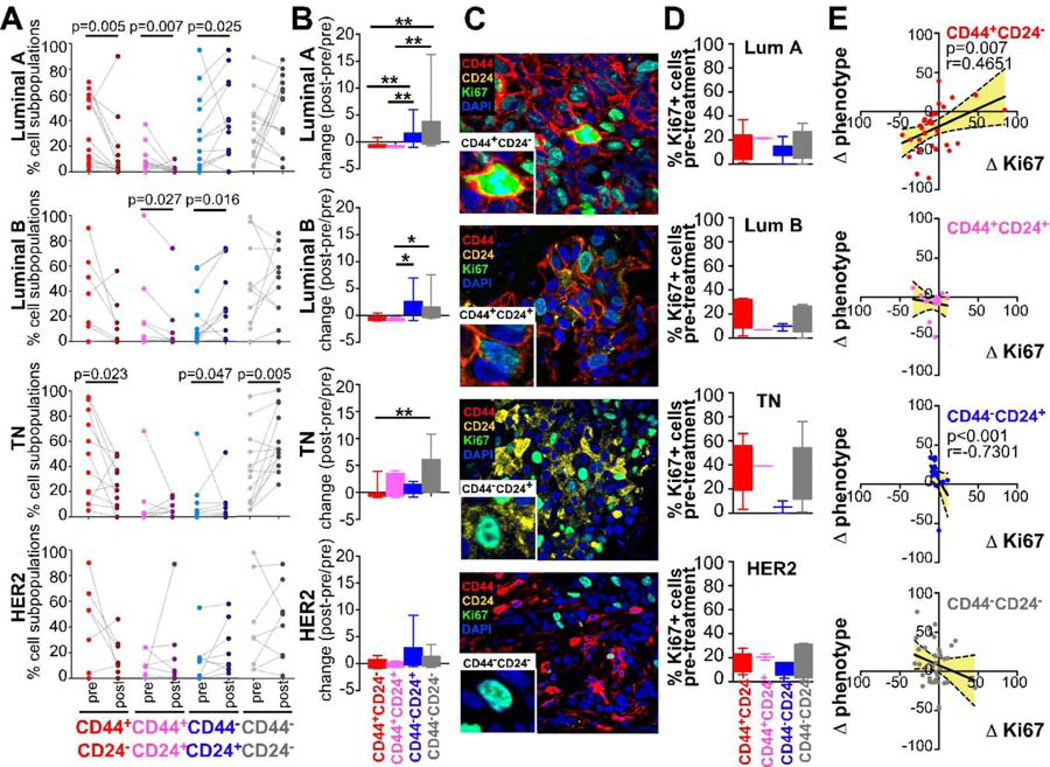
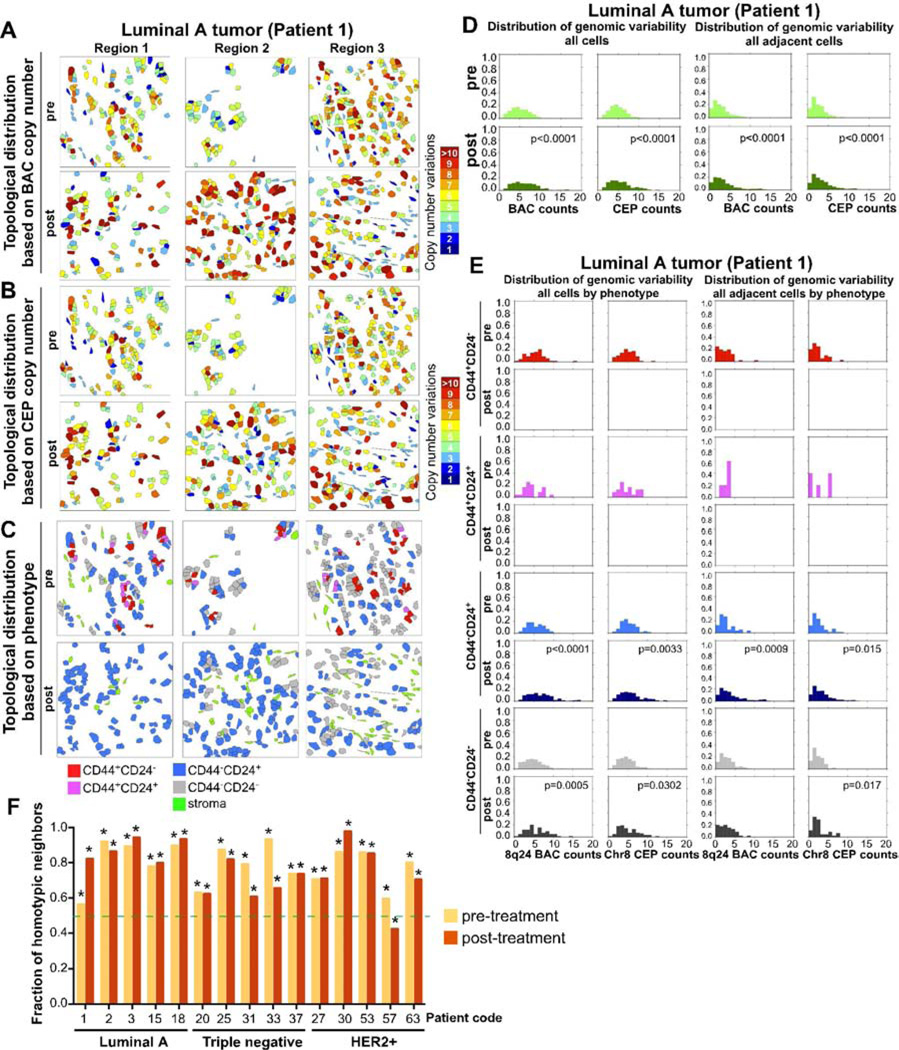
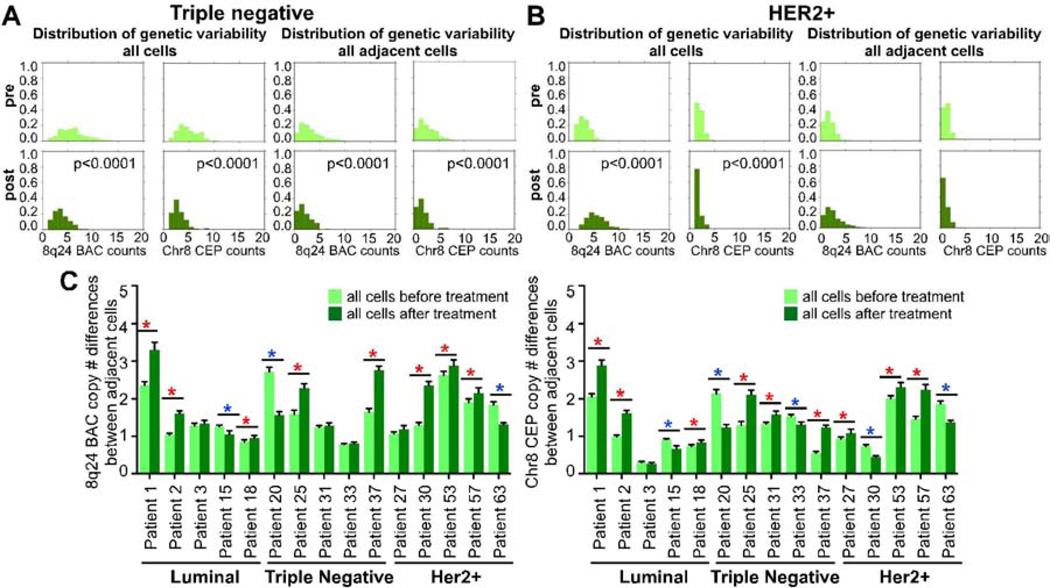
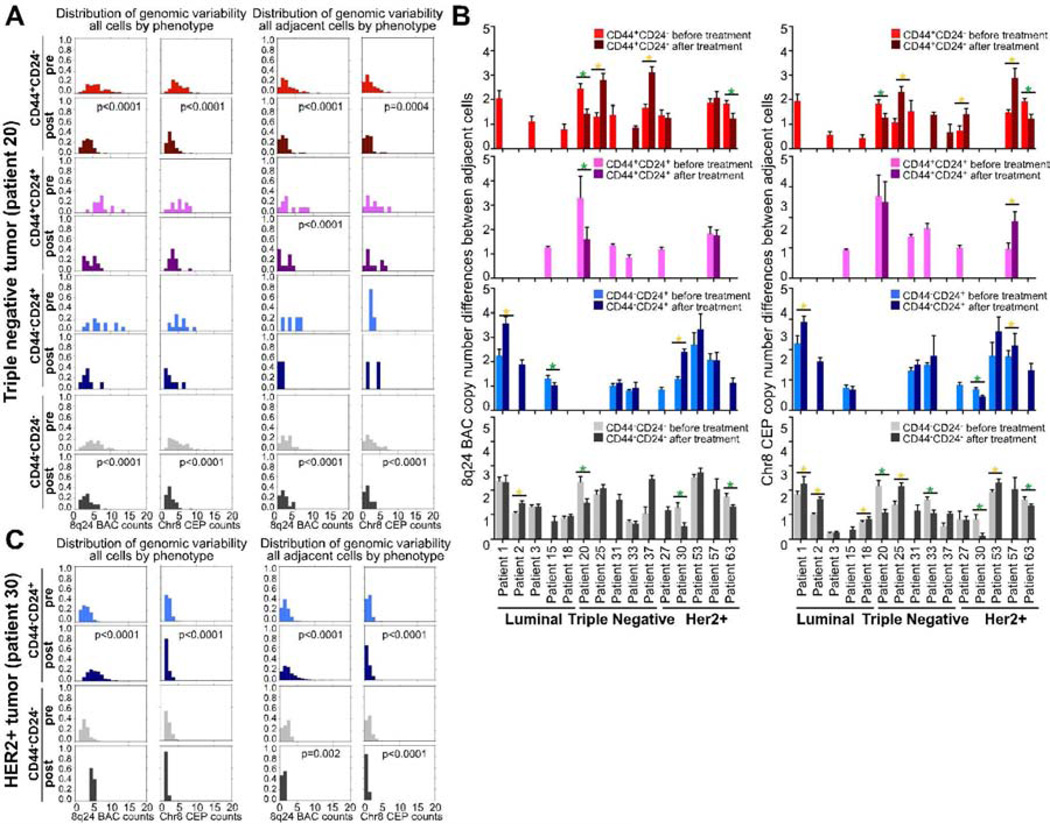
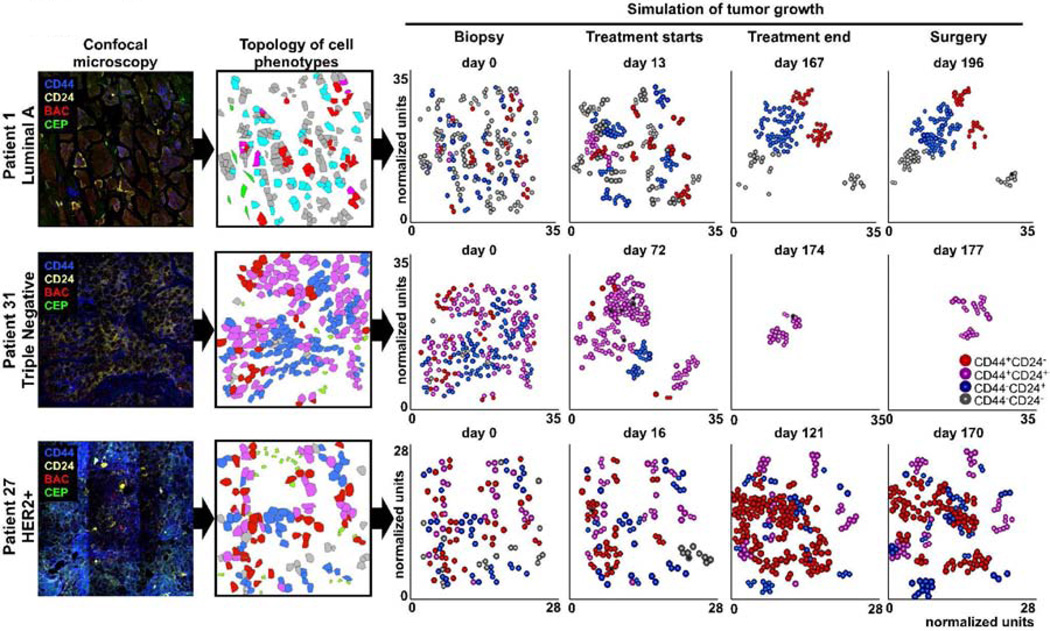
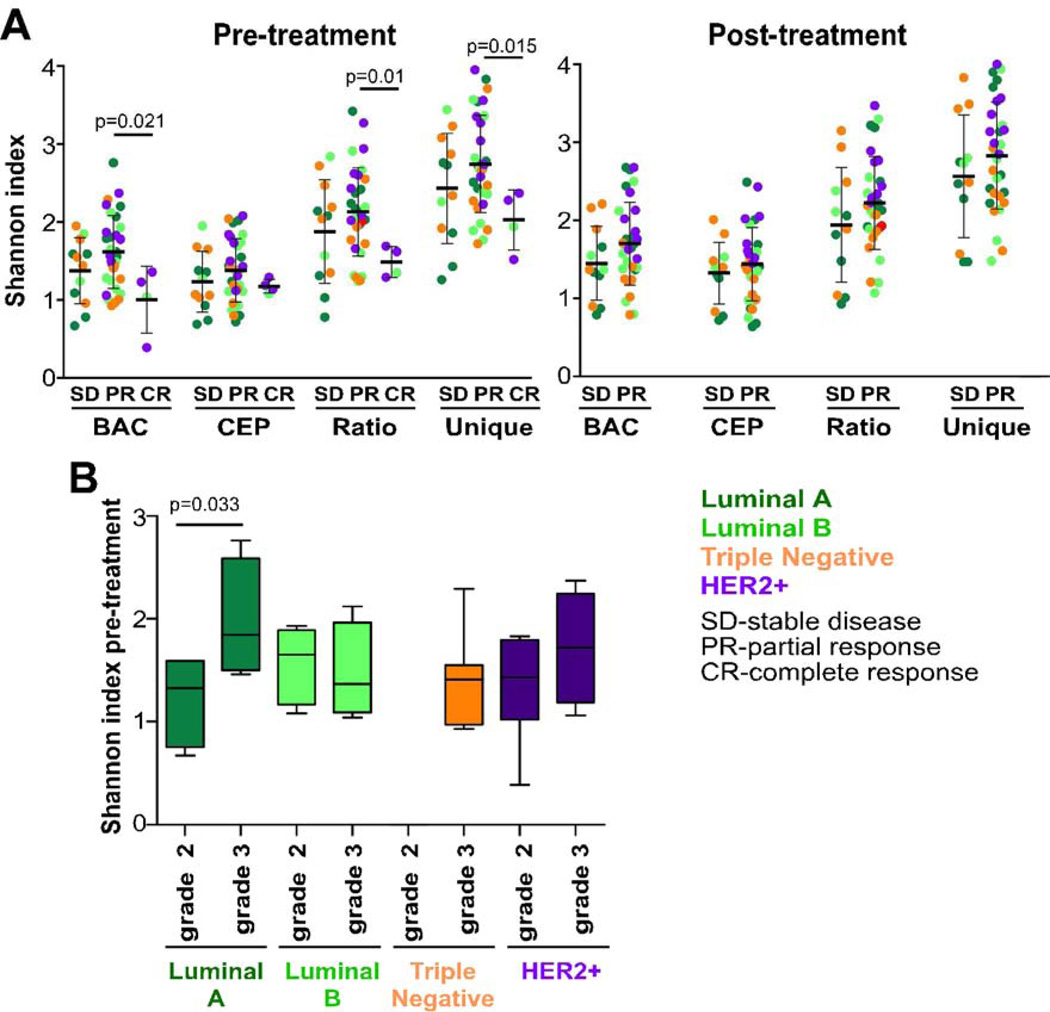
Cancer therapy exerts a strong selection pressure that shapes tumor evolution, yet our knowledge of how tumors change during treatment is limited. Here, we report the analysis of cellular heterogeneity for genetic and phenotypic features and their spatial distribution in breast tumors pre- and post-neoadjuvant chemotherapy. We found that intratumor genetic diversity was tumor-subtype specific, and it did not change during treatment in tumors with partial or no response. However, lower pretreatment genetic diversity was significantly associated with pathologic complete response. In contrast, phenotypic diversity was different between pre- and posttreatment samples. We also observed significant changes in the spatial distribution of cells with distinct genetic and phenotypic features. We used these experimental data to develop a stochastic computational model to infer tumor growth patterns and evolutionary dynamics. Our results highlight the importance of integrated analysis of genotypes and phenotypes of single cells in intact tissues to predict tumor evolution.


Figures

Figure 1
Figure 1. Genetic diversity in breast cancer according tumor subtype and treatment
(A) Representative images of iFISH in four tumors of the indicated subtypes before and after treatment. (B) Shannon index of diversity in each tumor subtype before and after treatment calculated based on unique BAC and CEP counts for each cell. Each dot represents an individual tumor, black line shows mean ± S.E.M., colors indicate luminal A (dark green), luminal B (light green), triple negative (orange), and HER2+ (violet) tumor subtypes. Asterisks mark significant differences (* p≤ 0.05 and ** p≤ 0.01, respectively, by Wilcoxon rank sum test) between subtypes. (C) Correlations between Shannon indices in each tumor before and after treatment and the relative change in diversity in each tumor. Black line shows mean±SEM. (D) Correlations between pre- and post-treatment Shannon indices in the indicated cell subpopulations and tumor subtypes. Not all cell subpopulations are present in all tumors. (E) Shannon index in phenotypically distinct subpopulations in individual tumors before and after treatment. Each vertical line separates individual cases. (F) Correlations between Shannon indices in each tumor before and after treatment for the indicated loci. See also Figure S1, Table S1 and S2.
Figure 2
Figure 2. Changes in phenotypic heterogeneity and cell type-specific variations in proliferation rates
(A) Changes in the frequency of the indicated cell subpopulations in the different tumor subtypes. Dotted line connects values for each cell subpopulation before and after treatment. Significant p values by two-sided Wilcoxon matched-pairs signed rank test are shown. (B) Box plot depicts relative changes in the frequency of each of the four cell subpopulations. Boxes correspond to 25th to 75th percentile whereas whiskers mark maximum and minimum values. Asterisks indicate statistically significant differences (* p<0.05, ** p<0.01) by two-sided Wilcoxon matched-pairs signed rank test. (C) Representative immunofluorescence images of Ki67 staining in specific cell subpopulations. (D) Frequency of Ki67+ cells before treatment. Boxes correspond to 25th to 75th percentile whereas whiskers mark maximum and minimum values. (E) Correlation between differences (Δ denotes post- minus pre-treatment values) in the frequency of cell subpopulations and % of Ki67+ cells after treatment. Negative values indicate a decrease of each variable after treatment. A 95% confidence interval is indicated in yellow. See also Figure S2 and S3.
Figure 3
Figure 3. Analysis of tumor topology
Maps showing topologic differences in the distribution of genetically distinct tumor cells based on copy number for 8q24 BAC (A), chromosome 8 CEP (B), and cellular phenotype (C) in three different regions of a luminal A tumor (Patient 1). (D) Histograms depicting absolute differences in copy numbers for BAC and CEP probe counts regardless of phenotype in all cells or in adjacent cells before and after treatment. (E) Histograms depicting absolute differences in copy numbers for BAC and CEP probe counts in all cells of the same phenotype or in adjacent cells of the same phenotype before and after treatment. CD44+CD24 and CD44+CD24+ cell subpopulations are not present after treatment. (F) Fraction of adjacent cells with the same phenotype before and after treatment. Asterisks indicate significant changes. Significance of differences was determined by calculating the homotypic fraction for 100,000 iterations of permutation testing over randomized cellular phenotypes. See also Figure S4, S5, and Table S3.
Figure 4
Figure 4. Genotype of all cells and adjacent cells within tumors
Histograms depicting variability for 8q24 BAC and Chr8 CEP probe counts regardless of phenotype in all cells (left panel) or in adjacent cells (right panel) before and after treatment in a triple negative tumor (Patient 20) (A) and in a HER2+ tumor (patient 30) (B). (C) Summary of differences for 8q24 BAC or Chr8 CEP probe counts in all cells before and after treatment in the 15 tumors analyzed. Asterisks mark significant differences, red and blue color indicates increase and decrease in differences, respectively. Data is presented as mean ± S.E.M.
Figure 5
Figure 5. Genetic and phenotypic differences between all cells and adjacent cells
(A) Histograms depicting variability for 8q24 BAC and Chr8 probe counts in all cells of the same phenotype (left panel) or in adjacent cells of the same phenotype (right panel) before and after treatment in a triple negative tumor (Patient 20). (B) Plots depicting differences in 8q24 BAC and Chr8 CEP copy numbers differences in all adjacent cells and in adjacent cells of the same phenotype. Asterisks indicate significant differences, yellow and green color indicates increase and decrease in differences, respectively. Data is presented as mean ± S.E.M. (C) Similar as panel A, histograms for a HER2+ tumor (patient 30).
Figure 6
Figure 6. Examples of snapshots of computer simulated tumor growth during treatment
Representative images depicting changes in tumor topology and cellular composition during treatment based on simulations. Modeling was built based on actual data obtained from cases analyzed for topology. Confocal images were converted into topology maps for the distribution of cell phenotypes that served as time zero for the mathematical simulations of tumor growth. See also Table S4 and Video S1.
Figure 7
Figure 7. Associations between intratumor diversity and pathologic response to treatment
(A) Shannon index of diversity before and after treatment in tumors with different response to treatment. Significant p values between groups by Wilcoxon rank sum test are indicated. Black lines show the mean ± S.E.M.. Tumors with lower pretreatment diversity are more likely to have complete pathologic response regardless of tumor subtype. Tumors with complete response were only analyzed prior to treatment, as there was no tumor tissue left at the time of surgery. (B) Shannon index of diversity before and after treatment in tumors with different grade. Boxes correspond to 25th to 75th percentile whereas whiskers mark maximum and minimum values. Significant p values by two-sided Wilcoxon matched-pairs signed rank test are shown. See also Figure S6 and Table S5.

Comment in

References

    1. Comprehensive molecular portraits of human breast tumours. Nature. 2012;490:61–70. - PMC - PubMed
    1. Al-Hajj M, Wicha MS, Benito-Hernandez A, Morrison SJ, Clarke MF. Prospective identification of tumorigenic breast cancer cells. Proc Natl Acad Sci U S A. 2003;100:3983–3988. - PMC - PubMed
    1. Almendro V, Marusyk A, Polyak K. Cellular heterogeneity and molecular evolution in cancer. Annu Rev Pathol. 2013;8:277–302. - PubMed
    1. Bloushtain-Qimron N, Yao J, Snyder EL, Shipitsin M, Campbell LL, Mani SA, Hu M, Chen H, Ustyansky V, Antosiewicz JE, et al. Cell type-specific DNA methylation patterns in the human breast. Proc Natl Acad Sci U S A. 2008;105:14076–14081. - PMC - PubMed
    1. Burcombe R, Wilson GD, Dowsett M, Khan I, Richman PI, Daley F, Detre S, Makris A. Evaluation of Ki-67 proliferation and apoptotic index before, during and after neoadjuvant chemotherapy for primary breast cancer. Breast Cancer Res. 2006;8:R31. - PMC - PubMed

Publication types

Substances