

Causal effects of body mass index on cardiometabolic traits and events: a Mendelian randomization analysis
- PMID: 24462370
- PMCID: PMC3928659
- DOI: 10.1016/j.ajhg.2013.12.014
Causal effects of body mass index on cardiometabolic traits and events: a Mendelian randomization analysis
Erratum in
- Am J Hum Genet. 2014 Feb 6;94(2):312
Abstract
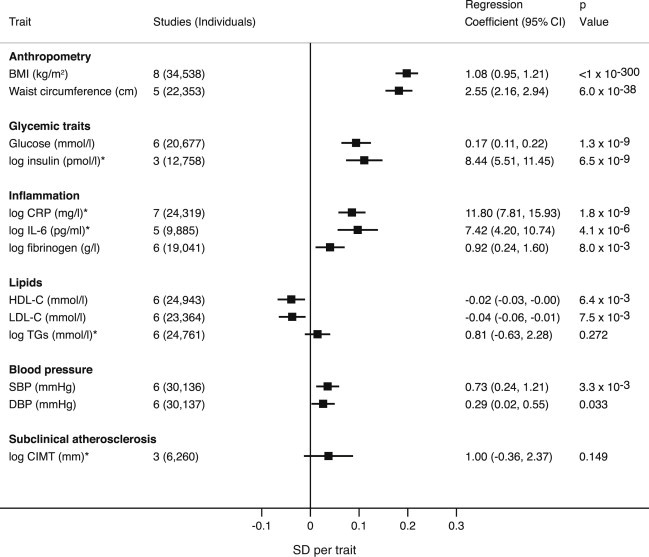
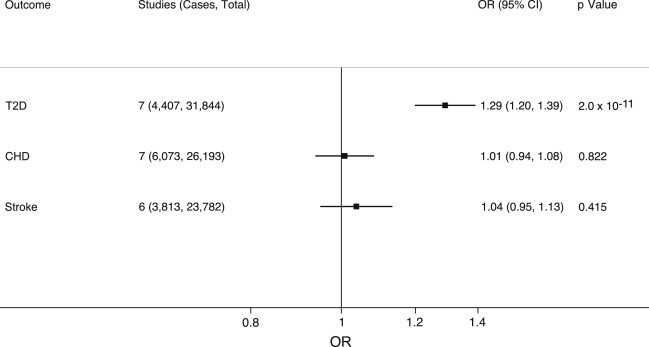
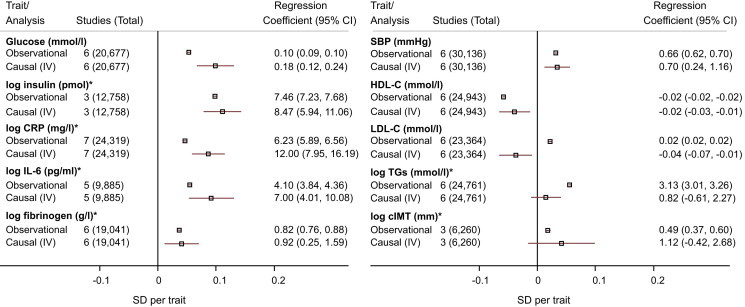
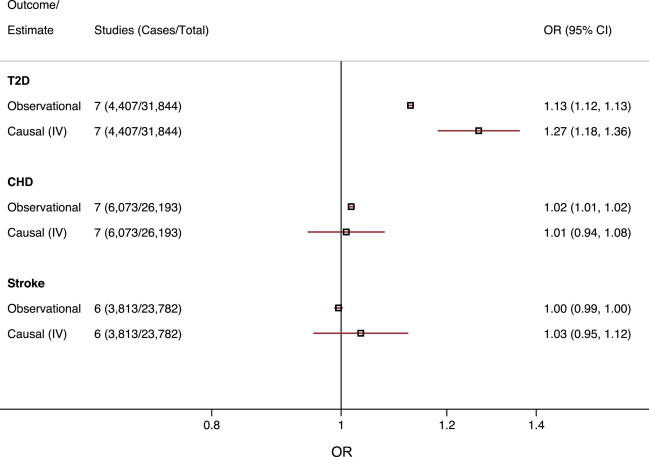
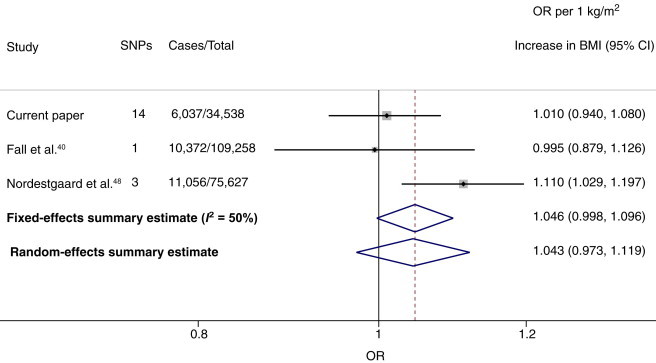
Elevated body mass index (BMI) associates with cardiometabolic traits on observational analysis, yet the underlying causal relationships remain unclear. We conducted Mendelian randomization analyses by using a genetic score (GS) comprising 14 BMI-associated SNPs from a recent discovery analysis to investigate the causal role of BMI in cardiometabolic traits and events. We used eight population-based cohorts, including 34,538 European-descent individuals (4,407 type 2 diabetes (T2D), 6,073 coronary heart disease (CHD), and 3,813 stroke cases). A 1 kg/m(2) genetically elevated BMI increased fasting glucose (0.18 mmol/l; 95% confidence interval (CI) = 0.12-0.24), fasting insulin (8.5%; 95% CI = 5.9-11.1), interleukin-6 (7.0%; 95% CI = 4.0-10.1), and systolic blood pressure (0.70 mmHg; 95% CI = 0.24-1.16) and reduced high-density lipoprotein cholesterol (-0.02 mmol/l; 95% CI = -0.03 to -0.01) and low-density lipoprotein cholesterol (LDL-C; -0.04 mmol/l; 95% CI = -0.07 to -0.01). Observational and causal estimates were directionally concordant, except for LDL-C. A 1 kg/m(2) genetically elevated BMI increased the odds of T2D (odds ratio [OR] = 1.27; 95% CI = 1.18-1.36) but did not alter risk of CHD (OR 1.01; 95% CI = 0.94-1.08) or stroke (OR = 1.03; 95% CI = 0.95-1.12). A meta-analysis incorporating published studies reporting 27,465 CHD events in 219,423 individuals yielded a pooled OR of 1.04 (95% CI = 0.97-1.12) per 1 kg/m(2) increase in BMI. In conclusion, we identified causal effects of BMI on several cardiometabolic traits; however, whether BMI causally impacts CHD risk requires further evidence.
Copyright © 2014 The American Society of Human Genetics. Published by Elsevier Inc. All rights reserved.
Figures
References
-
- Global Health Observatory (GHO). (2013). Obesity: Situation and Trends. World Health Organization, http://www.who.int/gho/ncd/risk_factors/obesity_text/en/index.html.
-
- Lewis C.E., McTigue K.M., Burke L.E., Poirier P., Eckel R.H., Howard B.V., Allison D.B., Kumanyika S., Pi-Sunyer F.X. Mortality, health outcomes, and body mass index in the overweight range: a science advisory from the American Heart Association. Circulation. 2009;119:3263–3271. - PubMed
Publication types
MeSH terms
Substances
Grants and funding
LinkOut - more resources
Full Text Sources
Other Literature Sources
Medical
Molecular Biology Databases
