Clinical Trial
. 2014 Apr;42(4):307-316.e8.
doi: 10.1016/j.exphem.2014.01.005. Epub 2014 Jan 23.

Aberrant expression of SALL4 in acute B cell lymphoblastic leukemia: mechanism, function, and implication for a potential novel therapeutic target

Affiliations
Clinical Trial

Aberrant expression of SALL4 in acute B cell lymphoblastic leukemia: mechanism, function, and implication for a potential novel therapeutic target

Shikiko Ueno et al. Exp Hematol. 2014 Apr.

Abstract

Treatment for high-risk pediatric and adult acute B cell lymphoblastic leukemia (B-ALL) remains challenging. Exploring novel pathways in B-ALL could lead to new therapy. Our previous study has shown that stem cell factor SALL4 is aberrantly expressed in B-ALL, but its functional roles and the mechanism that accounts for its upregulation in B-ALL remain unexplored. To address this question, we first surveyed the existing B-ALL cell lines and primary patient samples for SALL4 expression. We then selected the B-ALL cell lines with the highest SALL4 expression for functional studies. RNA interference was used to downregulate SALL4 expression in these cell lines. When compared with control cells, SALL4 knockdown cells exhibited decreased cell proliferation, increased apoptosis in vitro, and decreased engraftment in a xenotransplant model in vivo. Gene expression analysis showed that in SALL4 knockdown B-ALL cells, multiple caspase members involved in cell apoptosis pathway were upregulated. Next, we explored the mechanisms of aberrant SALL4 expression in B-ALL. We found that hypomethylation of the SALL4 CpG islands was correlated with its high expression. Furthermore, treatment of low SALL4-expressing B-ALL cell lines with DNA methylation inhibitor led to demethylation of the SALL4 CpG and increased SALL4 expression. In summary, to our knowledge, we are the first to show that the aberrant expression of SALL4 in B-ALL is associated with hypomethylation, and that SALL4 plays a key role in B-ALL cell survival and could be a potential novel target in B-ALL treatment.


Conflict of interest statement

Conflict of interest disclosure

No financial interest/relationships with financial interest relating to the topic of this article have been declared.

Figures

Figure 1
Figure 1
Aberrant SALL4 expression in primary B ALL samples and cell lines. (A) Data mining of SALL4 expression from public database GSE13351 revealed that SALL4 expression was higher in group 1 with TEL-AML1 translocation. The cytogenetic characteristics of other groups were listed. SALL4 expression in B-ALL cell lines (B) and primary cells (C). The expression level of SALL4 mRNAwas normalized to internal control GAPDH. Normal human bone marrow cells were used as controls (N = 3, ± SD).
Figure 2
Figure 2
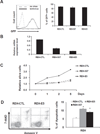
Downregulation of SALL4 in B-ALL cell lines leads to reduced cell growth and increased apoptosis. REH and Nalm6 cells were transduced with control scramble vector (CTL), or SALL4 shRNA lentiviral vectors (507 or E5) and then cultured for 48 hours. (A) Representative flow cytometry profile (left) and percentage (right) of lentivirus infected (GFP+) REH cells. (B) Total RNA of REH cells was isolated, and qRT-PCR was performed to determine the level of SALL4 mRNA upon viral infection. Expression levels were normalized to GAPDH. (N = 3, error bars, SD between three independent experiments). (C) MTS assay showed that SALL4 knockdown reduced growth curve on viable REH cells. The assay was performed in triplicate. (D) REH cells (1× 10⁶) were transduced with control vector (CTL) or different SALL4 shRNA lentiviral vectors (507 or E5), then cultured for 48 hours. Apoptotic cells were examined with Annexin Vand 7-AAD staining. Left, representative flow cytometric analysis of 7-AAD and Annexin V staining (right panel, percentage of apoptotic cells). (E) Percentage of lentivirus infected (GFP+) Nalm6 cells. (F) Relative SALL4 expression level of Nalm6 upon viral infection. Expression levels were normalized to GAPDH. (G) Percentage of apoptotic cells in Nalm6 transfected with E5 or Sc. Data are from three independent experiments and represented as mean ± SD. Similar results were obtained from Nalm6 cells (E–G). *p < 0.05.
Figure 2
Figure 2
Downregulation of SALL4 in B-ALL cell lines leads to reduced cell growth and increased apoptosis. REH and Nalm6 cells were transduced with control scramble vector (CTL), or SALL4 shRNA lentiviral vectors (507 or E5) and then cultured for 48 hours. (A) Representative flow cytometry profile (left) and percentage (right) of lentivirus infected (GFP+) REH cells. (B) Total RNA of REH cells was isolated, and qRT-PCR was performed to determine the level of SALL4 mRNA upon viral infection. Expression levels were normalized to GAPDH. (N = 3, error bars, SD between three independent experiments). (C) MTS assay showed that SALL4 knockdown reduced growth curve on viable REH cells. The assay was performed in triplicate. (D) REH cells (1× 10⁶) were transduced with control vector (CTL) or different SALL4 shRNA lentiviral vectors (507 or E5), then cultured for 48 hours. Apoptotic cells were examined with Annexin Vand 7-AAD staining. Left, representative flow cytometric analysis of 7-AAD and Annexin V staining (right panel, percentage of apoptotic cells). (E) Percentage of lentivirus infected (GFP+) Nalm6 cells. (F) Relative SALL4 expression level of Nalm6 upon viral infection. Expression levels were normalized to GAPDH. (G) Percentage of apoptotic cells in Nalm6 transfected with E5 or Sc. Data are from three independent experiments and represented as mean ± SD. Similar results were obtained from Nalm6 cells (E–G). *p < 0.05.
Figure 3
Figure 3
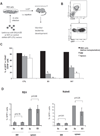
Downregulation of SALL4 significantly decreases the engraftment of REH cells in a mouse xenotransplantation model. (A) Schematic diagram of the xenotransplantation protocol. (B) Representative flow cytometric profile of GFP+ REH cells (CD45+CD19+). (C) SALL4 knockdown REH cells (GFP+) exhibited reduced engraftment in BM and spleen of recipient immunodeficient mice (N = 3). (D) No difference in homing between SALL4 knockdown and the control group was observed. Three hours after transplantation, recipient mice were sacrificed and analyzed for the percentage of GFP+ cells in BM and spleen by flow cytometry (N = 3). *p < 0.05.
Figure 4
Figure 4
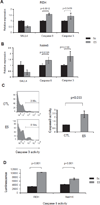
Caspases 3 and 8 are upregulated and activated upon SALL4 knockdown. (A, B) The expression of caspases 3 and 8 was examined by real-time qPCR in SALL4 knockdown REH (A), Nalm6 (B), and control-treated cells. (Error bars, SD of three or four independent experiments). (C) Caspase 3 activity increased in SALL4 knockdown Nalm6 when compared with control-treated cells. Seventy-two hours after lentiviral transduction, SALL4 knockdown and control-treated Nalm6 cells were collected for caspase 3 activity assay. Left, Representative flow cytometric profile and percentage of active caspase 3 cells after gated on GFP+ cells. Right, Bar graph showing the overall percentage of the caspase 3–positive cells in two groups with control group normalized to 1. (Error bars, SD of three independent experiments). (D) Increased caspase 8 activity in SALL4 knockdown REH and Nalm6. Caspase-Glo 8 assay was performed after 48 hours (REH) or 72 hours (Nalm6) after lentiviral transduction.
Figure 5
Figure 5
Hypomethylation of the CpG sites is correlated with SALL4 expression. (A) Diagram on SALL4 exon1/intron1 region. Six pairs of primers were designed to cover this region (one of the primers set e1–P5 is shown). The translation start site is represented by a filled, inverted triangle. Exon1 is represented by a short, gray rectangle with CpG islands in a long, gray rectangle. Each open circle represents one CpG. (B) Methylation status of the e1-P5 region in B-ALL cell lines (REH, Nalm6, 697 and Blin-1; upper panel). Each column represents a single CpG site. Methylation status of the e1-P5 region in B-ALL cell lines and seven primary samples (Nos. 1–7; lower panel). (C) Methylation status of the e1-P5 region in B-ALL cell lines (697 and Blin-1) after 5-Aza-dC treatment. The scale bar at bottom shows the percentage of methylation. Ten clones of each B-ALL cell line or primary sample were sequenced for evaluation of their methylation status. (D) SALL4 expression of 697 after 5-Aza-dC treatment. No-treatment 697 was set as 1. (E) SALL4 expression of Blin-1 after 5-Aza-dC treatment. No-treatment Blin-1 was set as 1.
Figure 5
Figure 5
Hypomethylation of the CpG sites is correlated with SALL4 expression. (A) Diagram on SALL4 exon1/intron1 region. Six pairs of primers were designed to cover this region (one of the primers set e1–P5 is shown). The translation start site is represented by a filled, inverted triangle. Exon1 is represented by a short, gray rectangle with CpG islands in a long, gray rectangle. Each open circle represents one CpG. (B) Methylation status of the e1-P5 region in B-ALL cell lines (REH, Nalm6, 697 and Blin-1; upper panel). Each column represents a single CpG site. Methylation status of the e1-P5 region in B-ALL cell lines and seven primary samples (Nos. 1–7; lower panel). (C) Methylation status of the e1-P5 region in B-ALL cell lines (697 and Blin-1) after 5-Aza-dC treatment. The scale bar at bottom shows the percentage of methylation. Ten clones of each B-ALL cell line or primary sample were sequenced for evaluation of their methylation status. (D) SALL4 expression of 697 after 5-Aza-dC treatment. No-treatment 697 was set as 1. (E) SALL4 expression of Blin-1 after 5-Aza-dC treatment. No-treatment Blin-1 was set as 1.

References

    1. Pui CH, Relling MV, Downing JR. Acute lymphoblastic leukemia. New Engl J Med. 2004;350:1535–1548. - PubMed
    1. Medvedovic J, Ebert A, Tagoh H, Busslinger M. Pax5: a master regulator of B cell development and leukemogenesis. Adv Immunol. 2011;111:179–206. - PubMed
    1. Kohlhase J, Heinrich M, Schubert L, et al. Okihiro syndrome is caused by SALL4 mutations. Hum Mol Genet. 2002;11:2979–2987. - PubMed
    1. Al-Baradie R, Yamada K, St Hilaire C, et al. Duane radial ray syndrome (Okihiro syndrome) maps to 20q13 and results from mutations in SALL4, a new member of the SAL family. Am J Hum Genet. 2002;71:1195–1199. - PMC - PubMed
    1. Warren M, Wang W, Spiden S, et al. A Sall4 mutant mouse model useful for studying the role of Sall4 in early embryonic development and organogenesis. Genesis. 2007;45:51–58. - PMC - PubMed

Publication types

MeSH terms

LinkOut - more resources