. 2014 Apr 8;129(14):1472-82.
doi: 10.1161/CIRCULATIONAHA.113.004742. Epub 2014 Jan 24.

Dominant frequency increase rate predicts transition from paroxysmal to long-term persistent atrial fibrillation

Affiliations

Dominant frequency increase rate predicts transition from paroxysmal to long-term persistent atrial fibrillation

Raphael P Martins et al. Circulation. .

Abstract

Background: Little is known about the mechanisms underlying the transition from paroxysmal to persistent atrial fibrillation (AF). In an ovine model of long-standing persistent AF we tested the hypothesis that the rate of electric and structural remodeling, assessed by dominant frequency (DF) changes, determines the time at which AF becomes persistent.

Methods and results: Self-sustained AF was induced by atrial tachypacing. Seven sheep were euthanized 11.5±2.3 days after the transition to persistent AF and without reversal to sinus rhythm; 7 sheep were euthanized after 341.3±16.7 days of long-standing persistent AF. Seven sham-operated animals were in sinus rhythm for 1 year. DF was monitored continuously in each group. Real-time polymerase chain reaction, Western blotting, patch clamping, and histological analyses were used to determine the changes in functional ion channel expression and structural remodeling. Atrial dilatation, mitral valve regurgitation, myocyte hypertrophy, and atrial fibrosis occurred progressively and became statistically significant after the transition to persistent AF, with no evidence for left ventricular dysfunction. DF increased progressively during the paroxysmal-to-persistent AF transition and stabilized when AF became persistent. Importantly, the rate of DF increase correlated strongly with the time to persistent AF. Significant action potential duration abbreviation, secondary to functional ion channel protein expression changes (CaV1.2, NaV1.5, and KV4.2 decrease; Kir2.3 increase), was already present at the transition and persisted for 1 year of follow up.

Conclusions: In the sheep model of long-standing persistent AF, the rate of DF increase predicts the time at which AF stabilizes and becomes persistent, reflecting changes in action potential duration and densities of sodium, L-type calcium, and inward rectifier currents.

Keywords: atrial fibrillation; electrophysiological; fibrosis; ion channels; refractory period.


Conflict of interest statement

Conflict of Interest Disclosures: Dr. Jalife is on the Scientific Advisory Board of avertAF. Dr. Berenfeld is the Scientific Officer of Rhythm Solutions, Inc.

Figures

Figure 1
Figure 1
Time-course of AF development. A: representative 3D plot of percentage of AF episodes in a given week (Y-axis) vs episode duration (X-axis) and weeks of follow-up after initiation of pacing (Z-axis). The first paroxysmal episode occurred 3 weeks after initiation of pacing. Duration of episodes progressively increased until persistent AF developed (week 12). B: summary of temporal measurements. AF: Atrial fibrillation; LS-PAF: Long-Standing Persistent AF.
Figure 2
Figure 2
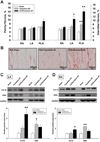
AF-induced changes in extracellular matrix. A: Mean±SEM values for patchy fibrosis (left) and interstitial fibrosis (right) in right atrium (RA), left atrium (LA) and posterior left atrium (PLA) of sham-operated (N=6), transition (N=7) and LS-PAF (N=7). Twenty pictures per slide were randomly selected and analyzed; *p<0.05; **p<0.001 vs. sham. B: Representative picrosirius red staining of PLA of sham-operated, transition and LS-PAF. C and D: Western blots of α-smooth muscle actin (SMA) and Collagen III (Col III) in LA and RA tissue homogenates relative to GAPDH. N=6 for each group. *p<0.05, **p<0.01 vs. sham. N = number of animals.
Figure 3
Figure 3
Dominant frequency increases in RA and LA (A) and surface ECG (B) during progression of AF. N=14 for RA, N=8 for LA. #p<0.001 for RA vs. LA, **p<0.001 vs. sham. N= number of animals.
Figure 4
Figure 4
Rate of increase in DF during paroxysmal AF predicts transition to persistent AF. A: Representative graphs for three animals. Left, sheep with the highest dDF/dt (0.14 Hz/day, time to transition 19 days); middle, intermediate dDF/dt (0.03 Hz/day, time to transition 46 days); right, lowest dDF/dt (0.003 Hz/day, time to transition 346 days); left and right from transition group, middle from LS-PAF group. B: log-log plots of time from first episode to onset of self-sustained persistent AF versus dDF/dt for the RA (intracardiac electrode), LA (loop recorder) and ECG (surface Lead 1). Each point represents an animal. dDF/dt correlated with time to develop self-sustained persistent AF. N=14 for RA and ECG, N=8 for LA.
Figure 5
Figure 5
APD and frequency dependence in myocytes from sham, transition, and persistent AF. A: Action potential duration (APD90 at 1Hz) is reduced in both atria at transition from paroxysmal to persistent AF. For RA: N=3/n=13 (sham), N=3/n=13 (transition), N=3/n=14 (LS-PAF); for LA: N=3/n=18 (sham), N=3/n=14 (transition), N=3/n=18 (LS-PAF). *p<0.05. Right: Representative LA APs are superimposed. B: Cycle length (CL) dependence of APD90. For RA: N=3/n=13 (sham), N=3/n=13 (transition), N=3/n=14 (LS-PAF); for LA: N=3/n=18 (sham), N=3/n=14 (transition), N=3/n=18 (LS-PAF). *p<0.05 Transition and LS-PAF vs. sham at 1000 ms CL. #p<0.05 Sham at 300ms vs. sham at v1000ms CL. N= number of animals; n= number of cells.
Figure 6
Figure 6
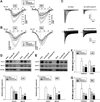
Sustained AF reduces functional expression of Na+ and L-type Ca2+ channels. A: Current-voltage relationships for INa in myocytes from LA (left) and RA (right). For LA: N=3/n=12 (sham), N=4/n=21 (transition), N=5/n=21 (LS-PAF); for RA: N=3/n=10 (sham), N=4/n=18 (transition), N=5/n=18 (LS-PAF). *p<0.05 vs. sham, # p<0.05 vs. transition. B: Current-voltage relationships for ICaL in myocytes from LA (left) and RA (right). For the LA: N=3/n=13 (sham), N=4/n=17 (transition), N=4/n=11 (LS-PAF); for the RA: N=3/n=12 (sham), N=4/n=16 (transition), N=4/n=14 (LS-PAF). *p<0.05 vs. sham. C: Representative traces for INa (upper) and ICaL (lower) in myocytes from LA of sham-operated and LS-PAF animal. D–E: Western blot analysis of NaV1.5 and CaV1.2 protein expression in LA tissue homogenates (D) and RA tissue homogenates (E). Top, Representative blots; bottom, Quantification of protein expression relative to GAPDH. N=6. F–G: Real time RT-PCR analysis of SNC5A and CACNA1C gene expression in tissue homogenates from LA (F) and RA (G); quantification of gene expression relative to GAPDH. N=6. **p< 0.01 vs. sham. N= number of animals; n= number of cells.
Figure 7
Figure 7
Sustained AF increases functional expression of Kir2.3. A: Current-voltage relationships for IK1 in myocytes from LA (top) and RA (bottom). For LA: N=3/n=7 (sham), N=5/n=10 (transition), N=2/n=4 (LS-PAF); for RA: N=3/n=6 (sham), N=3/n=10 (transition), N=3/n=9 (LS-PAF). *p<0.05 vs. sham. B: Western blots for Kir2.3 in LA tissue homogenates. Top: representative blots of 2 different groups; bottom: quantification of protein expression relative to GAPDH. N=6. *p<0.05 vs. sham. N= number of animals; n= number of cells.
Figure 8
Figure 8
Simulations predict consequences of ion channel remodeling on rotor frequency. A: Action potential traces for sham, paroxysmal and transition AF predicted by experimentally derived ion channel changes (Figures 6–7). APD90 was abbreviated in both paroxysmal and transition AF compared to sham. Resting membrane potential was hyperpolarized −2 mV. B: Rotor in paroxysmal (left) had lower frequency than transition AF. C: Rotors in paroxysmal AF meandered considerably and eventually self-terminated upon collision with boundary. In transition AF, the rotor was stable, had higher frequency and persisted throughout the simulation.

References

    1. de Vos CB, Pisters R, Nieuwlaat R, Prins MH, Tieleman RG, Coelen RJ, van den Heijkant AC, Allessie MA, Crijns HJ. Progression from paroxysmal to persistent atrial fibrillation clinical correlates and prognosis. J Am Coll Cardiol. 2010;55:725–731. - PubMed
    1. Allessie M, Ausma J, Schotten U. Electrical, contractile and structural remodeling during atrial fibrillation. Cardiovasc Res. 2002;54:230–246. - PubMed
    1. Van Wagoner DR, Pond AL, Lamorgese M, Rossie SS, McCarthy PM, Nerbonne JM. Atrial l-type ca2+ currents and human atrial fibrillation. Circ Res. 1999;85:428–436. - PubMed
    1. Voigt N, Trausch A, Knaut M, Matschke K, Varro A, Van Wagoner DR, Nattel S, Ravens U, Dobrev D. Left-to-right atrial inward rectifier potassium current gradients in patients with paroxysmal versus chronic atrial fibrillation. Circ Arrhythm Electrophysiol. 2010;3:472–480. - PMC - PubMed
    1. Caballero R, de la Fuente MG, Gomez R, Barana A, Amoros I, Dolz-Gaiton P, Osuna L, Almendral J, Atienza F, Fernandez-Aviles F, Pita A, Rodriguez-Roda J, Pinto A, Tamargo J, Delpon E. In humans, chronic atrial fibrillation decreases the transient outward current and ultrarapid component of the delayed rectifier current differentially on each atria and increases the slow component of the delayed rectifier current in both. J Am Coll Cardiol. 2010;55:2346–2354. - PubMed

Substances