. 2014 Feb;124(2):859-70.
doi: 10.1172/JCI70941. Epub 2014 Jan 27.

Taxonomy of breast cancer based on normal cell phenotype predicts outcome

Taxonomy of breast cancer based on normal cell phenotype predicts outcome

Sandro Santagata et al. J Clin Invest. 2014 Feb.

Abstract

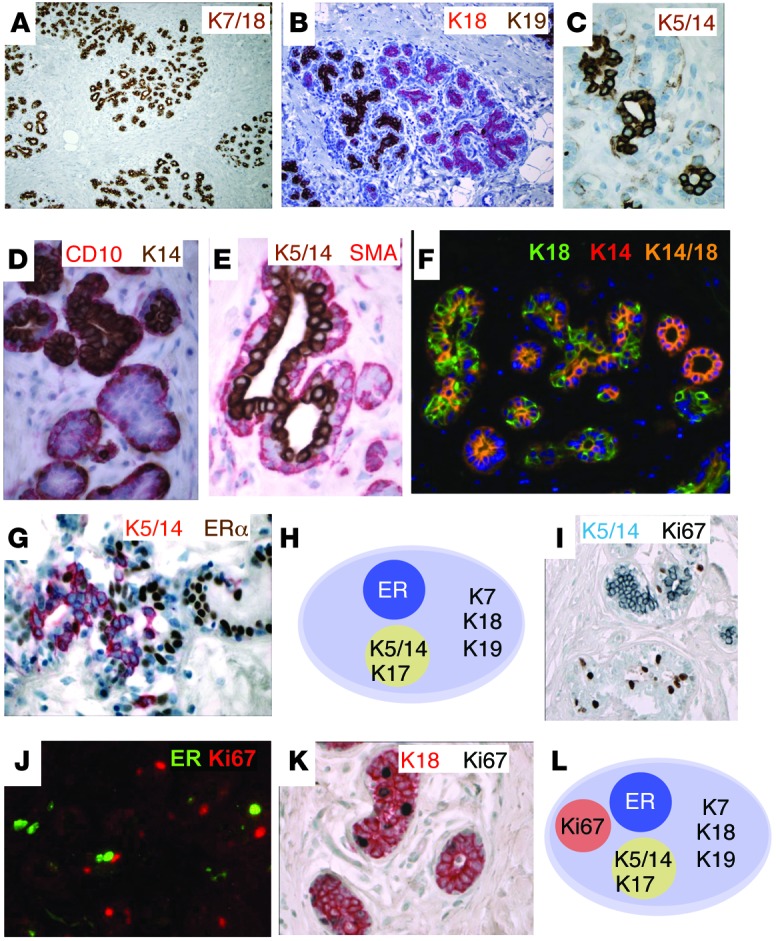
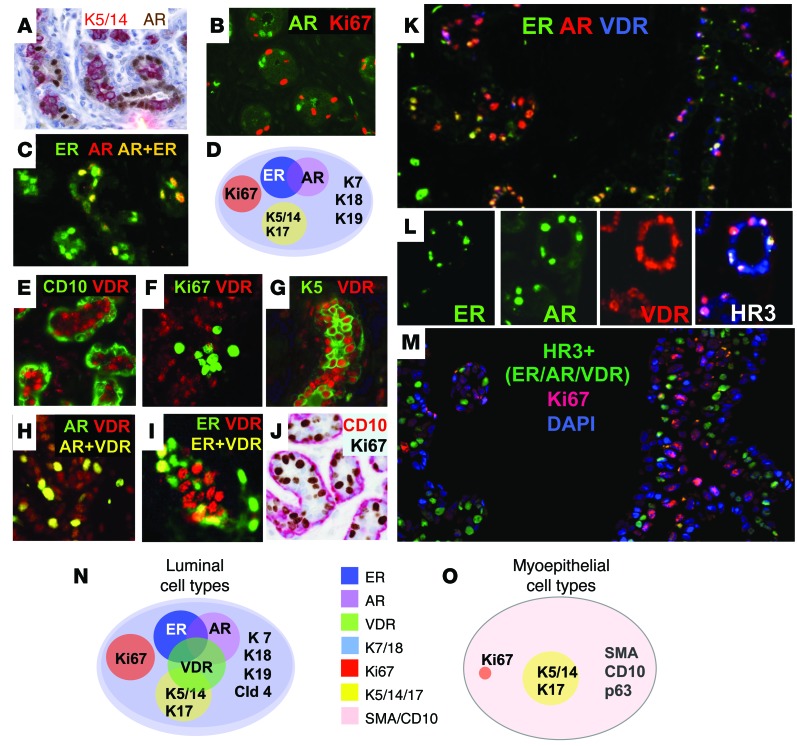
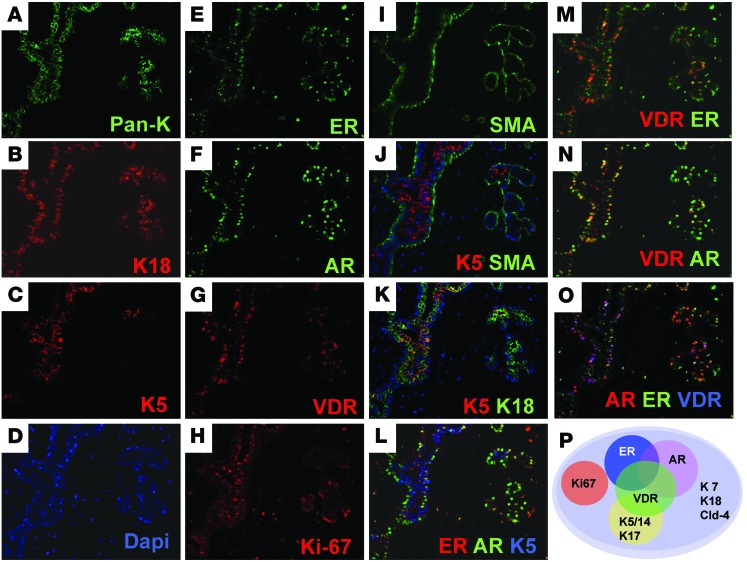
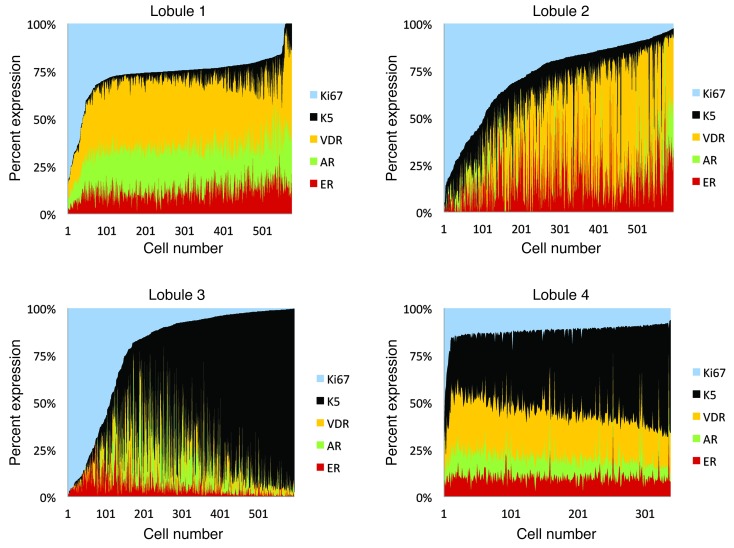
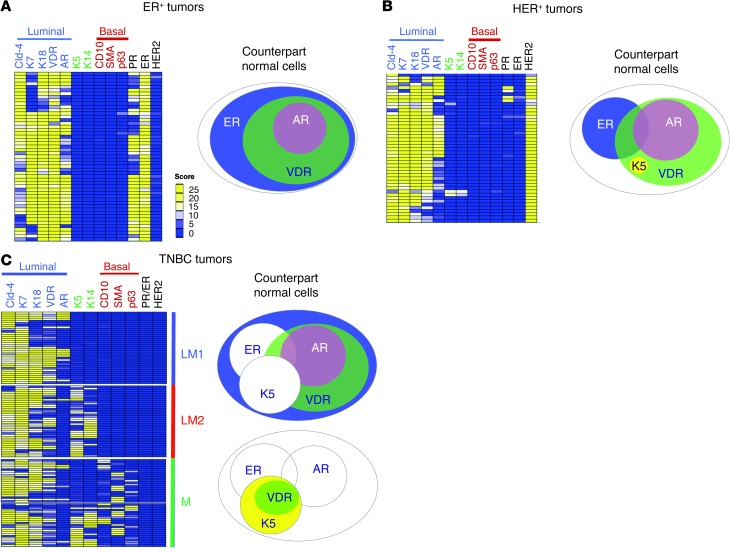
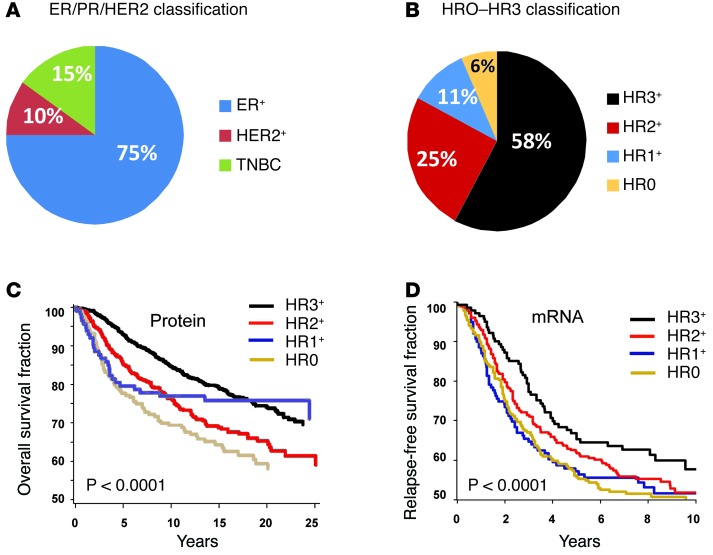
Accurate classification is essential for understanding the pathophysiology of a disease and can inform therapeutic choices. For hematopoietic malignancies, a classification scheme based on the phenotypic similarity between tumor cells and normal cells has been successfully used to define tumor subtypes; however, use of normal cell types as a reference by which to classify solid tumors has not been widely emulated, in part due to more limited understanding of epithelial cell differentiation compared with hematopoiesis. To provide a better definition of the subtypes of epithelial cells comprising the breast epithelium, we performed a systematic analysis of a large set of breast epithelial markers in more than 15,000 normal breast cells, which identified 11 differentiation states for normal luminal cells. We then applied information from this analysis to classify human breast tumors based on normal cell types into 4 major subtypes, HR0-HR3, which were differentiated by vitamin D, androgen, and estrogen hormone receptor (HR) expression. Examination of 3,157 human breast tumors revealed that these HR subtypes were distinct from the current classification scheme, which is based on estrogen receptor, progesterone receptor, and human epidermal growth factor receptor 2. Patient outcomes were best when tumors expressed all 3 hormone receptors (subtype HR3) and worst when they expressed none of the receptors (subtype HR0). Together, these data provide an ontological classification scheme associated with patient survival differences and provides actionable insights for treating breast tumors.


Figures

Figure 1
Figure 1. Expression of intermediate filaments and ER in normal human breast.
Single and double IHC with immunoperoxidase (AE, G, I, and K) and merged IHC images (F and J) of normal human FFPE sections are shown. (A) K7/18 (brown). (B) K18 (red) and K19 (brown). (C) K5/14 (brown). (D) CD10 (red) and K14 (brown). (E) K5/14 (brown) and SMA (red). (F) K18 (green) and K14 (red). Merged K14+K18+ appears yellow. (G) K5/14 (red) and ER (brown). We designated this population of cells K5/14/17+ because the tissue sections were not stained simultaneously with these markers. (H) Differentiation states of normal luminal epithelial cells, based on expression of ER and keratins. (I) Ki67 (brown) and K5/14 (blue). (J) ER (green) and Ki67 (red). (K) K18 (red) and Ki67 (brown). (L) Differentiation states of normal luminal epithelial cells, based on ER, keratins, and Ki67. Representative images were selected from multiple patient samples (n = 36). Original magnification, ×20 (A); ×40 (B); ×200 (F); ×400 (C, G, and IK); ×600 (D and E). See http://sylvester.org/ince for additional high-resolution images.
Figure 2
Figure 2. Expression of intermediate filaments, ER, AR, and VDR in normal human breast.
Double IHC (A and J) and merged images (B, C, EI, and KM) of normal human breast FFPE sections, as well as differentiation states of luminal (D and N) and myoepithelial (O) cell types, are shown. (A) K5/14 (red) and AR (brown). (B) AR (green) and Ki67 (red). (C) ER (green) and AR (red). Merged ER+AR+ appears yellow. (D) Differentiation states of normal luminal epithelial cells based on presence of ER, keratins, Ki67, and AR. (E) CD10 (green) and VDR (red). (F) VDR (red) and Ki67 (green). (G) K5 (green) and VDR (red). (H) AR (green) and VDR (red). Merged AR+VDR+ appears yellow. (I) ER (green) and VDR (red). Merged ER+VDR+ appears yellow. (J) CD10 (red) and Ki67 (brown). (K) ER (green), AR (red), and VDR (blue). Merged ER+AR+ appears yellow; merged ER+VDR+ appears purple. (L) ER (green), AR (green), and VDR (red) shown individually. In the merged image, ER+AR+VDR+ (i.e., HR3) appears white. (M) HR3 (green), Ki67 (red), and DAPI (blue; nuclear marker). (N and O) Differentiation states of normal luminal (N) and myoepithelial (O) breast cells based on the full marker panel. Representative images were selected from multiple patient samples (n = 36). Original magnification, ×200 (AC, EK, and M); ×400 (L). See http://sylvester.org/ince for additional high-resolution images.
Figure 3
Figure 3. Multiplex IF of 12 markers in normal human breast.
(AI) 1 FFPE section of normal breast epithelium was stained serially with each antibody for the markers (A) pan-keratin (Pan-K, green), (B) K18 (red), (C) K5 (red), (D) DAPI (blue), (E) ER (green), (F) AR (green), (G) VDR (red), (H) Ki67 (red), and (I) SMA (green). (JO) The individual IF staining images were merged to reveal the coexpression pattern of all markers in each cell. (J) K5 (red) and SMA (green). (K) K5 (red) and K18 (green). (L) ER (red), AR (green), and K5 (blue). (M) VDR (red) and ER (green). (N) VDR (red) and AR (green). (O) AR (red), ER (green), and VDR (blue). (P) Differentiation states of normal luminal breast cells based on the full marker panel. Representative images were acquired using multiplex IF technology (GE Healthcare). Original magnification, ×200 (AO). See http://sylvester.org/ince for additional high-resolution images, including K7, Cld-4, NaKATPase, and CD10 stains.
Figure 4
Figure 4. Multiplex analysis of 12 markers in normal human breast.
Histograms of relative ER, AR, VDR, K5, and Ki67 expression in each luminal cell in normal human breast lobules 1–4. Cell number is plotted against percent contribution of each marker to total fluorescence of each cell. See Supplemental Figure 3 for additional lobules.
Figure 5
Figure 5. Identification of normal cellular phenotypes in human breast tumors.
Heat maps of Cld-4, K7, K18, VDR, AR, K5, K14, CD10, SMA, p63, PR, ER, and HER2 protein levels in 216 human breast cancer tumors, separated into (A) ER+ (n = 51), (B) HER2+ (n = 46), and (C) TNBC (n = 119). Luminal markers (Cld-4, K7, K18, VDR, and AR) and basal markers (CD10, SMA, and p63) are indicated. TNBCs are separated into luminal 1 (LM1; K5/14), luminal 2 (LM2; K5/14+), and mixed (M; expressing both luminal and myoepithelial markers) subtypes. TMA sections were subjected to IHC and scored using light microscopy on a scale of 0 (blue, low expression) to 25 (yellow, high expression), with white denoting intermediate expression. Corresponding normal cell counterparts are illustrated next to each heat map.
Figure 6
Figure 6. Normal cell subtype-based classification identifies breast cancers with different outcomes.
(A) Distribution of ER+, HER2+ and TNBC cases from the full panel of NHS cases analyzed in this study. (B) Reclassification of ER+, HER2+, and TNBC human breast tumors from the full panel of NHS cases analyzed in this study as HR3 (ER+AR+VDR+), HR2 (ER+AR+, AR+VDR+, or ER+VDR+), HR1 (ER+, VDR+, or AR+), and HR0 (ERARVDR). Breast tumors were divided into the 4 HR0–HR3 categories based on normal tissue differentiation (see Supplemental Table 3). (C) Kaplan-Meier analysis for overall survival of all individuals with invasive breast cancer from the NHS, scored by IHC. (D) Kaplan-Meier analysis of relapse-free survival for all invasive breast cancers from an 855-patient breast tumor dataset (38). Tumors were ranked according to gene expression values for ER, AR, and VDR, scored as high or low based on a 50% cutoff point, and assembled based on HR status (HR0, n = 141; HR1, n = 287; HR2, n = 284; HR3, n = 143).

Comment in

References

    1. Swerdlow SH, et al. WHO Classification of Tumours of Haematopoietic and Lymphoid Tissue. 4th ed. Lyon, France: World Health Organization; 2008.
    1. Hamilton A, Gallipoli P, Nicholson E, Holyoake TL. Targeted therapy in haematological malignancies. J Pathol. 2010;220(4):404–418. - PubMed
    1. Wood GS, Warnke RA. The immunologic phenotyping of bone marrow biopsies and aspirates: frozen section techniques. Blood. 1982;59(5):913–922. - PubMed
    1. Drexler HG. Classification of acute myeloid leukemias--a comparison of FAB and immunophenotyping. Leukemia. 1987;1(10):697–705. - PubMed
    1. Jones C, et al. Expression profiling of purified normal human luminal and myoepithelial breast cells: identification of novel prognostic markers for breast cancer. Cancer Res. 2004;64(9):3037–3045. doi: 10.1158/0008-5472.CAN-03-2028. - DOI - PubMed

Publication types

MeSH terms