Clinical Trial
. 2014 Feb;124(2):499-508.
doi: 10.1172/JCI72227. Epub 2014 Jan 27.

Metabolic response to sodium-glucose cotransporter 2 inhibition in type 2 diabetic patients

Clinical Trial

Metabolic response to sodium-glucose cotransporter 2 inhibition in type 2 diabetic patients

Ele Ferrannini et al. J Clin Invest. 2014 Feb.

Erratum in

  • J Clin Invest. 2014 Apr 1;124(4):1868

Abstract

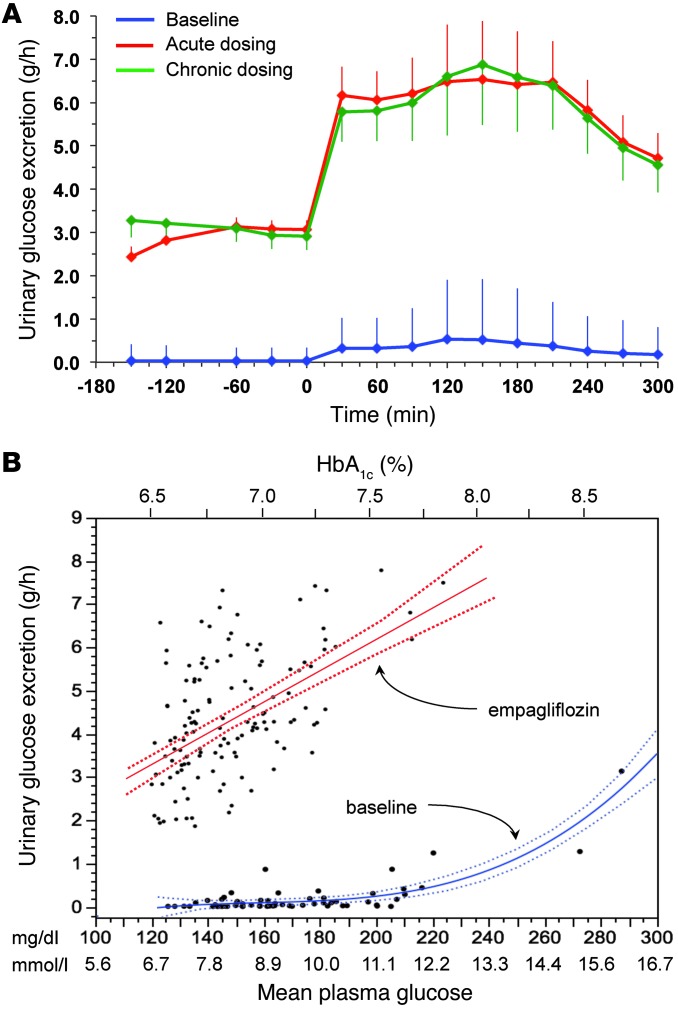
Background: Sodium-glucose cotransporter 2 (SGLT2) inhibitors lower glycemia by enhancing urinary glucose excretion. The physiologic response to pharmacologically induced acute or chronic glycosuria has not been investigated in human diabetes.

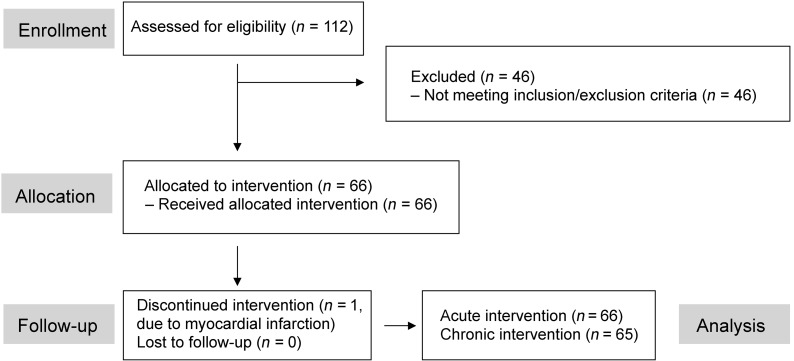
Methods: We evaluated 66 patients with type 2 diabetes (62 ± 7 years, BMI = 31.6 ± 4.6 kg/m(2), HbA1c = 55 ± 8 mmol/mol, mean ± SD) at baseline, after a single dose, and following 4-week treatment with empagliflozin (25 mg). At each time point, patients received a mixed meal coupled with dual-tracer glucose administration and indirect calorimetry.

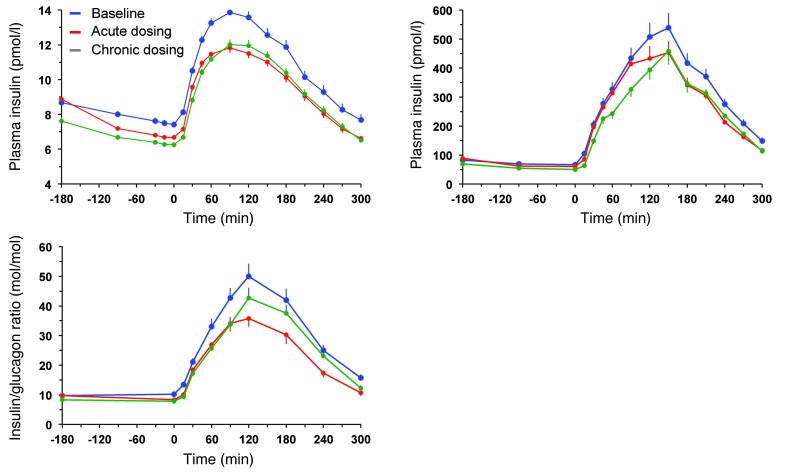
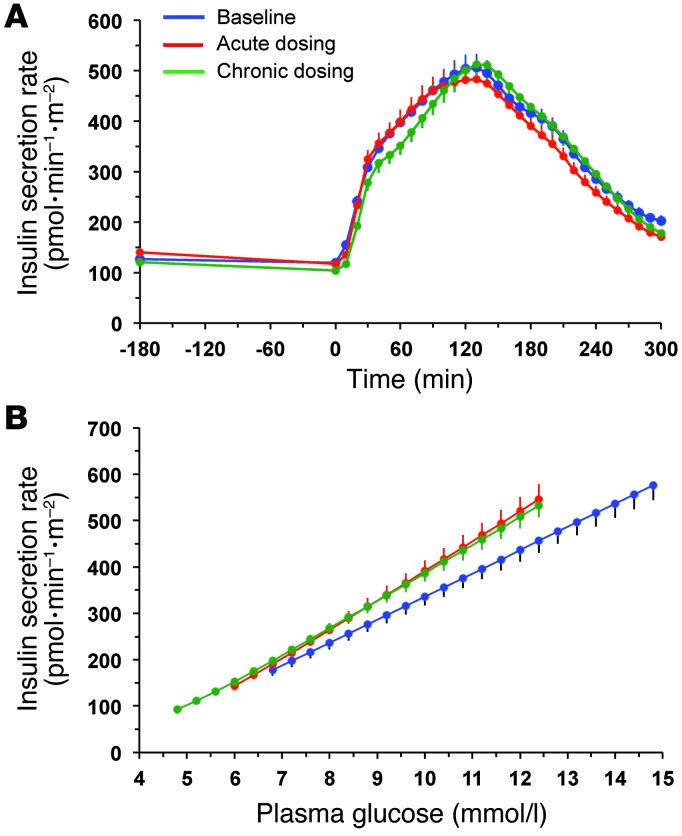
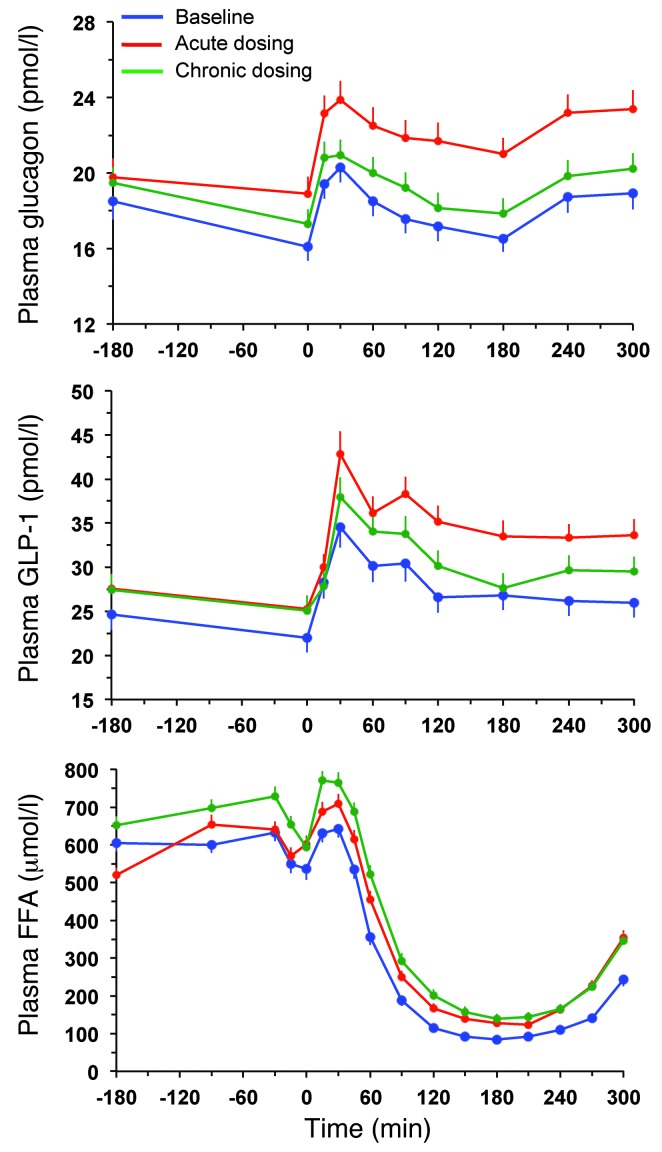
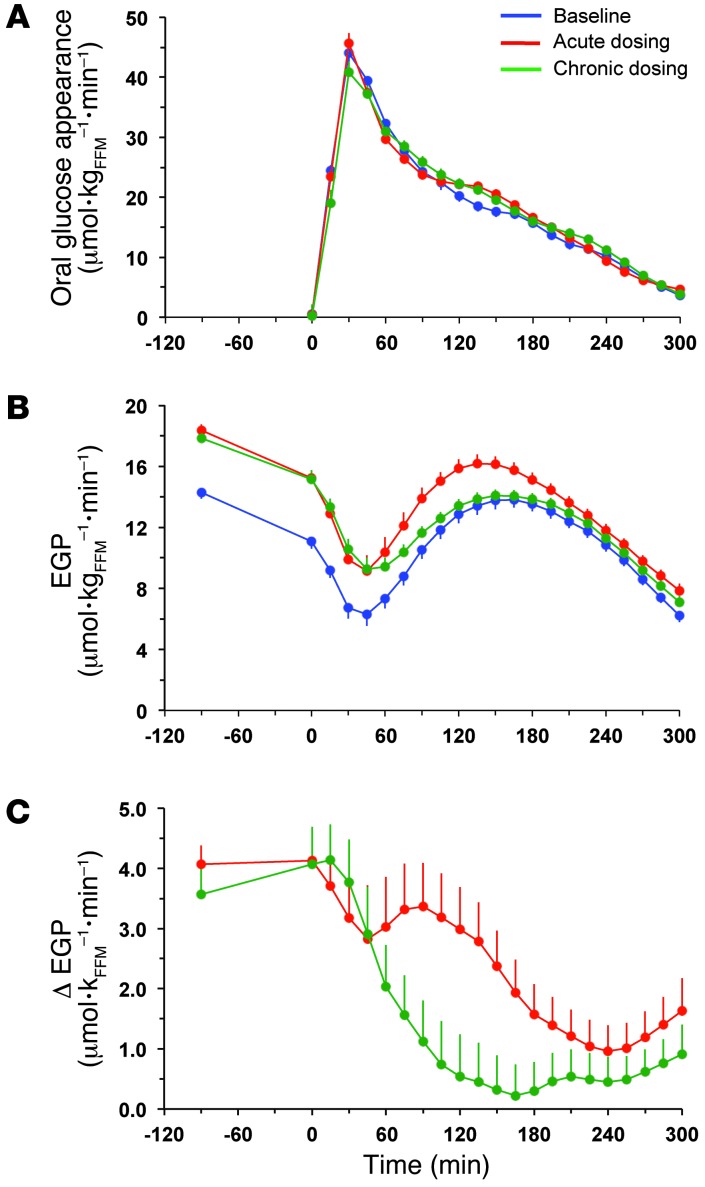
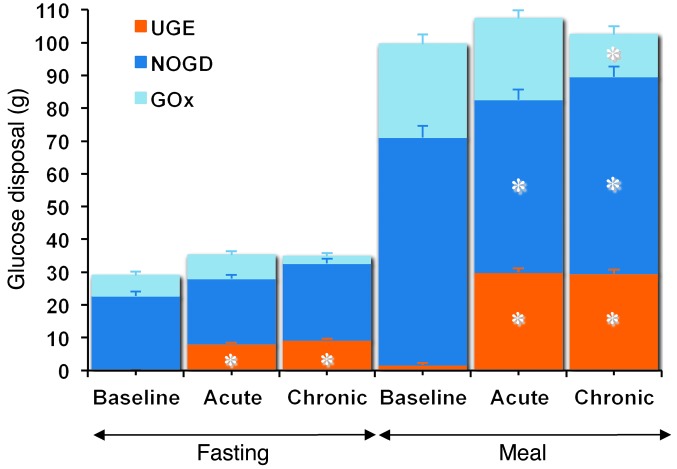
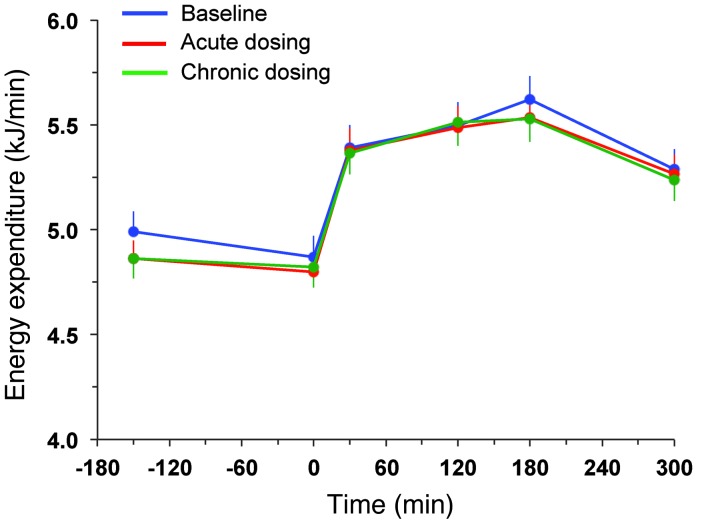
Results: Both single-dose and chronic empagliflozin treatment caused glycosuria during fasting (median, 7.8 [interquartile range {IQR}, 4.4] g/3 hours and 9.2 [IQR, 5.2] g/3 hours) and after meal ingestion (median, 29.0 [IQR, 12.5] g/5 hours and 28.2 [IQR, 15.4] g/5 hours). After 3 hours of fasting, endogenous glucose production (EGP) was increased 25%, while glycemia was 0.9 ± 0.7 mmol/l lower (P < 0.0001 vs. baseline). After meal ingestion, glucose and insulin AUC decreased, whereas the glucagon response increased (all P < 0.001). While oral glucose appearance was unchanged, EGP was increased (median, 40 [IQR, 14] g and 37 [IQR, 11] g vs. 34 [IQR, 11] g, both P < 0.01). Tissue glucose disposal was reduced (median, 75 [IQR, 16] g and 70 [IQR, 21] g vs. 93 [IQR, 18] g, P < 0.0001), due to a decrease in both glucose oxidation and nonoxidative glucose disposal, with a concomitant rise in lipid oxidation after chronic administration (all P < 0.01). β Cell glucose sensitivity increased (median, 55 [IQR, 35] pmol • min(-1) • m(-2) • mM(-1) and 55 [IQR, 39] pmol • min(-1) • m(-2) • mM(-1) vs. 44 [IQR, 32] pmol • min(-1) • m(-2) • mM(-1), P < 0.0001), and insulin sensitivity was improved. Resting energy expenditure rates and those after meal ingestion were unchanged.

Conclusions: In patients with type 2 diabetes, empagliflozin-induced glycosuria improved β cell function and insulin sensitivity, despite the fall in insulin secretion and tissue glucose disposal and the rise in EGP after one dose, thereby lowering fasting and postprandial glycemia. Chronic dosing shifted substrate utilization from carbohydrate to lipid. Trial registration. ClinicalTrials.Gov NCT01248364 (EudraCT no. 2010-018708-99). Funding. This study was funded by Boehringer Ingelheim.


Figures

Figure 1
Figure 1. Flow chart.
Flow chart of patient enrollment, allocation, and follow-up.
Figure 2
Figure 2. Plasma glucose and insulin concentrations and prehepatic insulin-to-glucagon ratio.
Plasma glucose and insulin concentrations as well as estimated prehepatic insulin-to-glucagon molar concentration ratio in 66 patients with type 2 diabetes at baseline, after a single dose of empagliflozin, and following 4 weeks of chronic empagliflozin administration during 3 hours of fasting and 5 hours after mixed meal ingestion. Plots represent mean ± SEM.
Figure 3
Figure 3. Insulin secretion rates and their relationship to prevailing plasma glucose concentrations.
(A) Insulin secretion rate in 66 patients with type 2 diabetes at baseline, after a single dose of empagliflozin, and following 4 weeks of chronic empagliflozin administration during 3 hours of fasting and 5 hours after mixed meal ingestion. (B) The data in A are plotted against the corresponding plasma glucose concentrations (compare with Figure 2): the mean slopes of the fitting lines measure β cell glucose sensitivity. Plots represent mean ± SEM.
Figure 4
Figure 4. Glucagon, GLP-1, and FFA response.
Plasma glucagon, GLP-1, and FFA concentrations in 66 patients with type 2 diabetes at baseline, after a single dose of empagliflozin, and following 4 weeks of chronic empagliflozin administration during 3 hours of fasting and 5 hours after mixed meal ingestion. Plots represent mean ± SEM.
Figure 5
Figure 5. Rates of appearance of oral and endogenous glucose.
(A) Rates of oral glucose appearance in patients with type 2 diabetes during the baseline study, after a single dose (acute study), and after 28 days of empagliflozin dosing (chronic study). (B) EGP in patients with type 2 diabetes during the baseline study, after a single dose, and after 28 days of empagliflozin dosing. (C) Point-by-point difference in EGP between the acute (red line) or chronic (green line) study and the baseline study in patients with type 2 diabetes. Plots represent mean ± SEM.
Figure 6
Figure 6. Partition of glucose disposal.
The stacked columns show the partition of total glucose disposal into glucose oxidation (GOx), nonoxidative glucose disposal (NOGD), and UGE during the fasting period (–180 to 0 minutes) and the period after meal ingestion (0 to 300 minutes) in patients with type 2 diabetes during the baseline study, after a single dose (acute study), and after 28 days of empagliflozin dosing (chronic study). Plots represent mean ± SEM. The asterisks indicate statistically significant differences from baseline (exact P values are given in Table 5).
Figure 7
Figure 7. Resting energy expenditure and that after meal ingestion.
Rates of energy expenditure during 3 hours of fasting and 5 hours after mixed meal ingestion in patients with type 2 diabetes during the baseline study, after a single dose (acute study), and after 28 days of empagliflozin dosing (chronic study). Plots represent mean ± SEM.
Figure 8
Figure 8. UGE.
(A) Time course of UGE during the fasting period (–180 to 0 minutes) and the period after meal ingestion (0 to 300 minutes) in patients with type 2 diabetes during the baseline study, after a single dose (acute study), and after 28 days of empagliflozin dosing (chronic study). Data were averaged over 30-minute time intervals and expressed as grams per hour. Plots represent mean ± SD. (B) The glucose excretion data in A are plotted against the corresponding mean plasma glucose concentration during the corresponding periods of urine collection (n = 66) for the baseline study (blue lines) and the 2 studies after dosing (n = 132); the latter were combined because they were fully overlapping (red lines). The blue lines are the quadratic polynomial fit and its 95% confidence intervals for the baseline data, and the red lines are the linear fit and its 95% confidence interval for the empagliflozin studies. The top x axis indicates HbA1c levels corresponding to the mean plasma glucose concentrations on the bottom x axis, derived by linear correlation of the entire data set.

Comment in

References

    1. Wright EM, Loo DD, Hirayama BA. Biology of human sodium glucose transporters. Physiol Rev. 2011;91(2):733–794. doi: 10.1152/physrev.00055.2009. - DOI - PubMed
    1. Hummel CS, Lu C, Loo DD, Hirayama BA, Voss AA, Wright EM. Glucose transport by human renal Na+/D-glucose cotransporters SGLT1 SGLT2. Am J Physiol Cell Physiol. 2011;300(1):C14–C21. doi: 10.1152/ajpcell.00388.2010. - DOI - PMC - PubMed
    1. Turner JM, Silverman M. Sugar uptake into brush border vesicles from normal human kidney. Proc Natl Acad Sci U S A. 1977;74(7):2825–2829. doi: 10.1073/pnas.74.7.2825. - DOI - PMC - PubMed
    1. Rossetti L, Smith D, Shulman GI, Papachristou D, DeFronzo RA. Correction of hyperglycemia with phlorizin normalizes tissue sensitivity to insulin in diabetic rats. J Clin Invest. 1987;79(5):1510–1515. doi: 10.1172/JCI112981. - DOI - PMC - PubMed
    1. Yki-Järvinen H. Glucose toxicity. Endocr Rev. 1992;13(3):415–31. - PubMed

Publication types

MeSH terms

Associated data