. 2014 Feb 13;506(7487):185-90.
doi: 10.1038/nature12975. Epub 2014 Jan 22.

A polygenic burden of rare disruptive mutations in schizophrenia

Affiliations

A polygenic burden of rare disruptive mutations in schizophrenia

Shaun M Purcell et al. Nature. .

Abstract

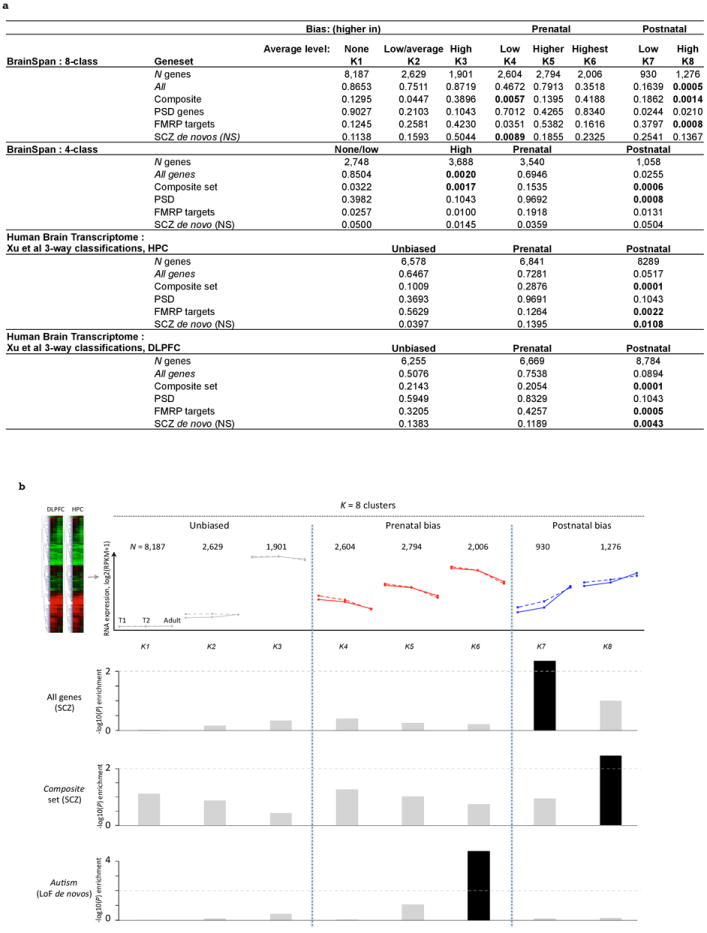
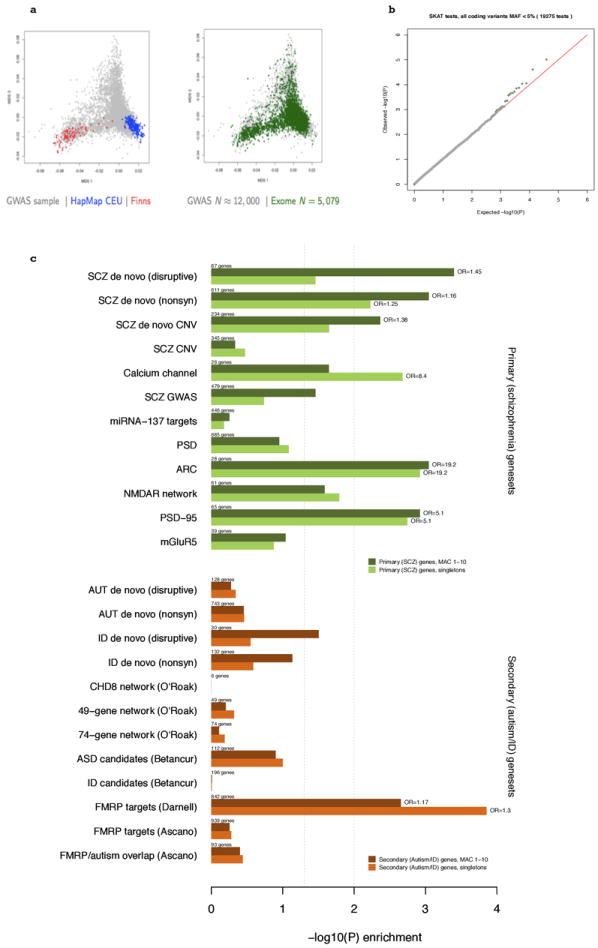
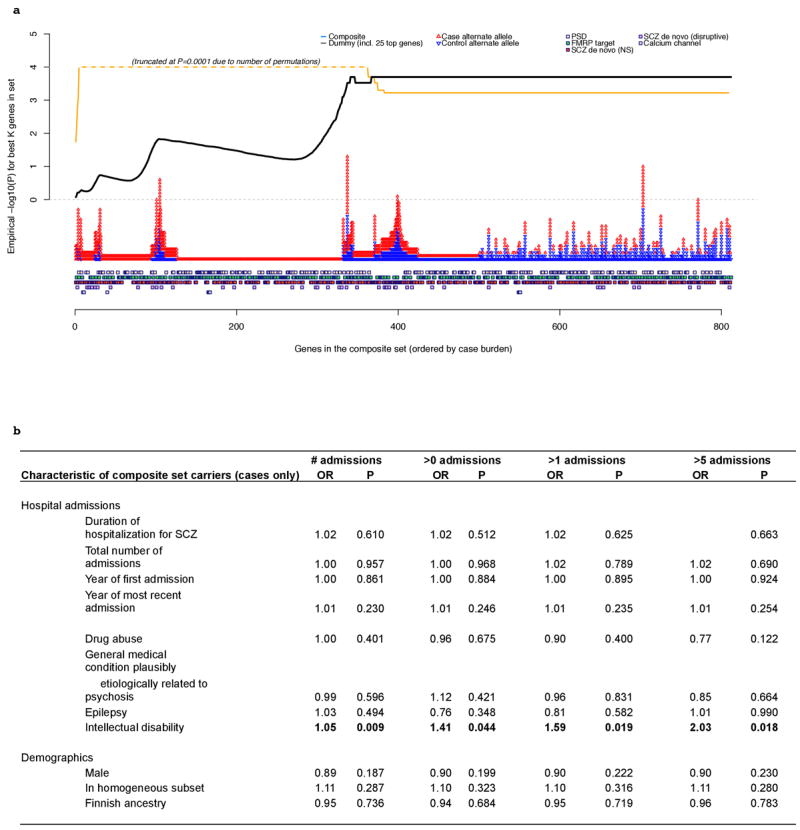
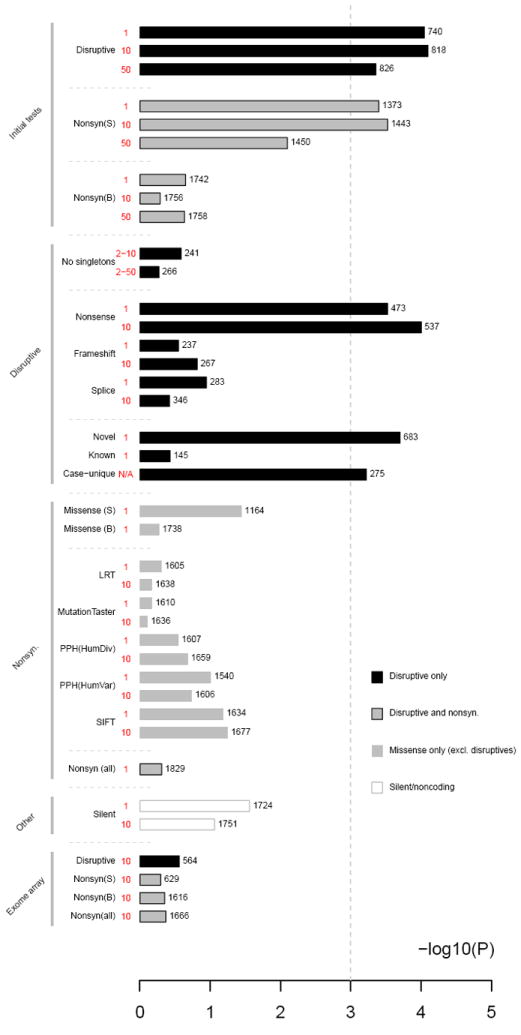
Schizophrenia is a common disease with a complex aetiology, probably involving multiple and heterogeneous genetic factors. Here, by analysing the exome sequences of 2,536 schizophrenia cases and 2,543 controls, we demonstrate a polygenic burden primarily arising from rare (less than 1 in 10,000), disruptive mutations distributed across many genes. Particularly enriched gene sets include the voltage-gated calcium ion channel and the signalling complex formed by the activity-regulated cytoskeleton-associated scaffold protein (ARC) of the postsynaptic density, sets previously implicated by genome-wide association and copy-number variation studies. Similar to reports in autism, targets of the fragile X mental retardation protein (FMRP, product of FMR1) are enriched for case mutations. No individual gene-based test achieves significance after correction for multiple testing and we do not detect any alleles of moderately low frequency (approximately 0.5 to 1 per cent) and moderately large effect. Taken together, these data suggest that population-based exome sequencing can discover risk alleles and complements established gene-mapping paradigms in neuropsychiatric disease.


Conflict of interest statement

The authors declare no competing financial interests.

Figures

Extended Data Figure 10
Extended Data Figure 10. Stratified enrichment analysis P-values by developmental trajectory of expression in brain (BrainSpan & Human Brain Transcriptome (HBT) datasets)
a. Uncorrected P-values for a set of exploratory analyses in which we stratified genes in the enrichment analyses by their developmental profile of brain expression. We used four schemes to classify genes as “brain expressed” and/or “biased” with respect to prenatal or postnatal expression (see SI section 6 and 10b below for details). We merged data on the hippocampus and dorsolateral prefrontal cortex for the BrainSpan classifications; to mirror the classification of Xu et al. (2012), we kept separate these two groupings for the HBT dataset. Results presented for MAF<0.1% disruptive variants; similar results are obtained for singletons with the exception that the “K4” prenatal enrichment signals are no longer significant. In general, the most consistent enrichment across variant classes, classification schemes and brain regions emerge for postnatally biased genes with high brain expression. b. Analysis of exome variants by developmental expression trajectory in human brain. Genes are grouped by cluster analysis of human postmortem brain expression into eight developmental trajectories, using RNA-sequencing data from the BrainSpan project. The top row gives the number of genes per cluster and the cluster centers in log2-scaled RPKM (reads per kilobase per million) values; solid and dotted solid lines indicate dorsolateral prefrontal cortex (DLPFC) and hippocampus (HPC) respectively. The bottom two rows show enrichment in the current study, relative to the exome-wide average, for singleton disruptive mutations in cases compared to controls, either subsetting all genes by expression profile (first row), or considering only genes in the composite set (second row). In both cases, we only observed nominally (P < 0.01) significant enrichment for genes that are postnatally biased. In contrast, a list of genes with loss-of-function (LoF) de novo mutations (compiled and reported in Fromer et al.) shows strong enrichment for prenatal bias (see Fromer et al. for details on how de novo enrichment was calculated). Alternative approaches to classifying genes as prenatally or postnatally biased led to similar conclusions (SI section 6).
Extended Data Figure 2
Extended Data Figure 2. Ancestry and association summaries
a. Multidimensional scaling plot of ancestry in the Swedish sample, including HapMap CEU and Finnish samples; showing sequenced individuals and the larger Swedish sample. b. Q-Q plot for gene-based SKAT results (MAF < 5% coding variants). Similar, or more conservative, profiles obtained for other subsets of variants. c Case enrichment of rare (MAF<0.1%) and singleton disruptive mutations for the constituent sets of the primary/schizophrenia gene set (top panel in green) and the secondary (autism/ID) geneset (bottom panel in orange). The primary set is enriched in cases (MAF<0.1% disruptive mutations P = 10-4; singletons P = 8×10⁻⁴, significant after correction for multiple testing) whereas the autism/ID shows only a modest trend (P = 0.04 and 0.03 for MAF<0.1% and singletons) and is not significant after correction. X-axis represents −log10(P); OR is odds ratio. Number of genes is for total in the set (whether or not they had a rare variant).
Extended Data Figure 9
Extended Data Figure 9. Genic and phenotypic subset analyses for the composite set
a. Individual gene-ranking of composite set genes. Genes are ranked by their case burden of rare disruptive mutations, from left to right, for the composite set. The squares along the bottom indicate to which sets each gene belongs. The red and blue triangles represent case and control counts for each gene. The lines above represent the statistical significance of the best test for this set: that is, the significance of the top K genes, evaluated by permutation. The black line represents results for the real data (disruptive MAF<0.1% composite set analysis). The orange line represents the dummy condition, in which we artificially constructed a set, where the number of genes, statistical enrichment, odds ratio and case/control counts where similar to the real composite set. However, this set included the 25 top-ranked genes from individual gene-based tests (disruptive MAF<0.1% variants), with the remainder selected at random. The profile of the best test line is markedly different between the real and dummy gene sets (note: truncated at P=0.0001 reflecting the number of permutations performed). Whereas the dummy P-value climbs quickly and then drops to the final aggregate result, the true composite set line continues to climb after 200 genes, indicating that many genes with a single disruptive mutation contribute to the observed set enrichment (rather than a relatively small proportion of the 1,796 genes accounting for the majority of the signal, as in the dummy set). b. Phenotypic characteristics of cases carrying mutations. Relationship between clinical and demographic measures in schizophrenia cases in relation to carrying one or more composite set disruptive risk alleles (MAF<0.1%). Hospital Discharge Registry data (ICD9 codes) were available on 979 of the 990 case carriers. All P-values (uncorrected) are two-sided from a case-only joint logistic regression of carrier status (one or more risk alleles) on all admission and demographic variables including year of first and last admissions. The four pairs of columns represent analyses in which we varied the way in which the HDR admission data were represented (for drug abuse, general medication condition, epilepsy and intellectual disability). “# admissions” = independent variables are the untransformed number of admissions; “>X admissions” = independent variable is binary 0/1 variable representing whether individuals had more than X admissions. Of all clinical/demographic measures considered, we observed a nominally-significant increased likelihood that cases carrying a disruptive allele in the composite set have increased rates of secondary diagnoses of intellectual disability compared to other cases (based on HDR ICD9 codes).
Figure 1
Figure 1. Composite set geneset analysis, stratified by mutation type
Statistical significance (x-axis) for the composite gene set stratified by type and frequency of mutation and other variables. Numbers to the right of each bar represent the number of genes with at least one mutation in that category for the composite set. (S) represents strictly-defined damaging missenses; (B) broadly-defined group. For the exome array contrasts (in which ExomeChip sites were tested using the exome sequence calls), D represents disruptive mutations, NS all nonsynonymous mutations.

Comment in

References

    1. Albrechtsen A, Grarup N, Li Y, Sparsø T, Tian G, Cao H, Jiang T, Kim SY, Korneliussen T, Li Q, Nie C, Wu R, Skotte L, Morris AP, Ladenvall C, Cauchi S, Stančáková A, Andersen G, Astrup A, Banasik K, Bennett AJ, Bolund L, Charpentier G, Chen Y, Dekker JM, Doney AS, Dorkhan M, Forsen T, Frayling TM, Groves CJ, Gui Y, Hallmans G, Hattersley AT, He K, Hitman GA, Holmkvist J, Huang S, Jiang H, Jin X, Justesen JM, Kristiansen K, Kuusisto J, Lajer M, Lantieri O, Li W, Liang H, Liao Q, Liu X, Ma T, Ma X, Manijak MP, Marre M, Mokrosiński J, Morris AD, Mu B, Nielsen AA, Nijpels G, Nilsson P, Palmer CN, Rayner NW, Renström F, Ribel-Madsen R, Robertson N, Rolandsson O, Rossing P, Schwartz TW, Slagboom PE, Sterner M, Tang M, Tarnow L, Tuomi T, Van’t Riet E, van Leeuwen N, Varga TV, Vestmar MA, Walker M, Wang B, Wang Y, Wu H, Xi F, Yengo L, Yu C, Zhang X, Zhang J, Zhang Q, Zhang W, Zheng H, Zhou Y, Altshuler D, ‘t Hart LM, Franks PW, Balkau B, Froguel P, McCarthy MI, Laakso M, Groop L, Christensen C, Brandslund I, Lauritzen T, Witte DR, Linneberg A, Jørgensen T, Hansen T, Wang J, Nielsen R, Pedersen O D.E.S.I.R. Study Group, the DIAGRAM Consortium. Exome sequencing-driven discovery of coding polymorphisms associated with common metabolic phenotypes. Diabetologia. 2013;56(2):298–310. - PMC - PubMed
    1. Bayés À, van de Lagemaat LN, Collins MO, Croning MDR, Whittle IR, Choudhary JS, Grant SGN. Characterisation of the proteome, diseases and evolution of the human postsynaptic density. Nature Neuroscience. 2011;14(1):19–21. - PMC - PubMed
    1. Berryer MH, Hamdan FF, Klitten LL, Møller RS, Carmant L, Schwartzentruber J, Patry L, Dobrzeniecka S, Rochefort D, Neugnot-Cerioli M, Lacaille JC, Niu Z, Eng CM, Yang Y, Palardy S, Belhumeur C, Rouleau GA, Tommerup N, Immken L, Beauchamp MH, Patel GS, Majewski J, Tarnopolsky MA, Scheffzek K, Hjalgrim H, Michaud JL, Di Cristo G. Mutations in SYNGAP1 cause intellectual disability, autism, and a specific form of epilepsy by inducing haploinsufficiency. Hum Mutat. 2013;34(2):385–94. - PubMed
    1. Callan MA, Zarnescu DC. Heads-up: new roles for the fragile × mental retardation protein in neural stem and progenitor cells. Genesis. 2011 Jun;49(6):424–40. - PubMed
    1. Cross-Disorder Group of the Psychiatric Genomics Consortium. Identification of risk loci with shared effects on five major psychiatric disorders: a genome-wide analysis. Lancet. 2013;381(9875):1371–9. - PMC - PubMed

Publication types

MeSH terms

Substances