. 2014 Mar 6;507(7490):104-8.
doi: 10.1038/nature12942. Epub 2014 Jan 26.

Citrullination regulates pluripotency and histone H1 binding to chromatin

Affiliations

Citrullination regulates pluripotency and histone H1 binding to chromatin

Maria A Christophorou et al. Nature. .

Abstract

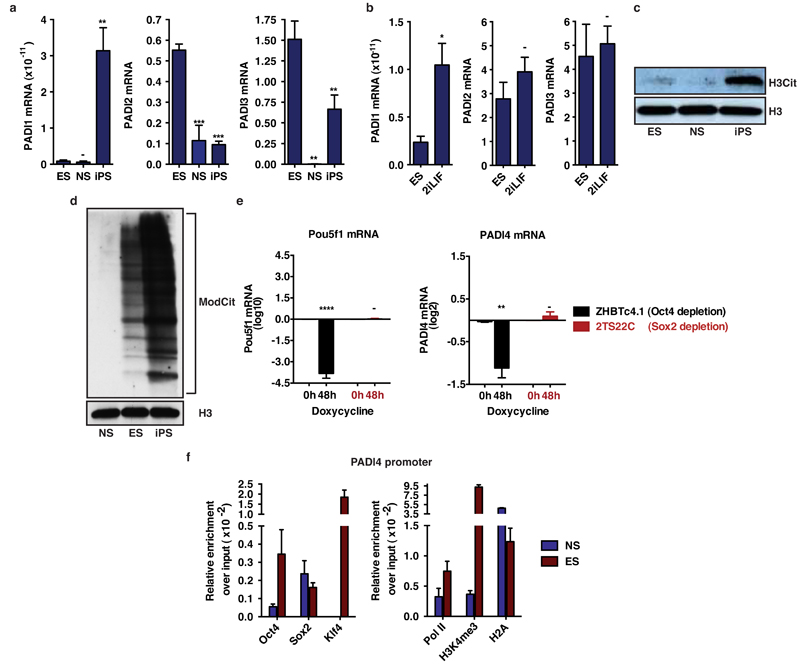
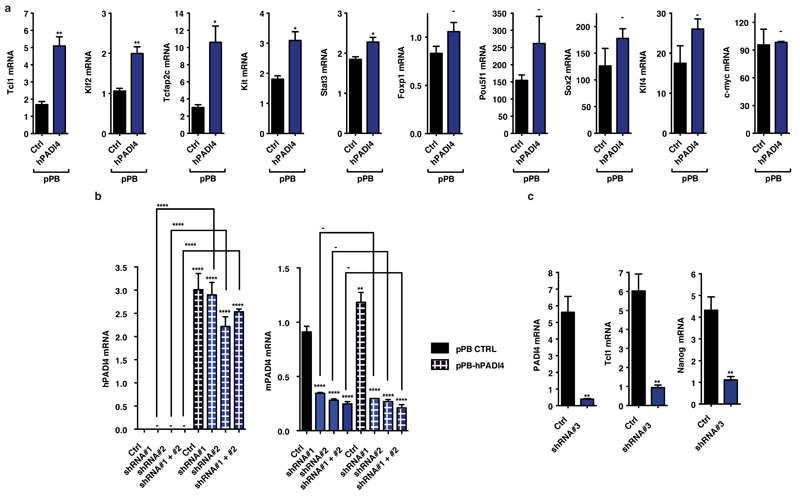
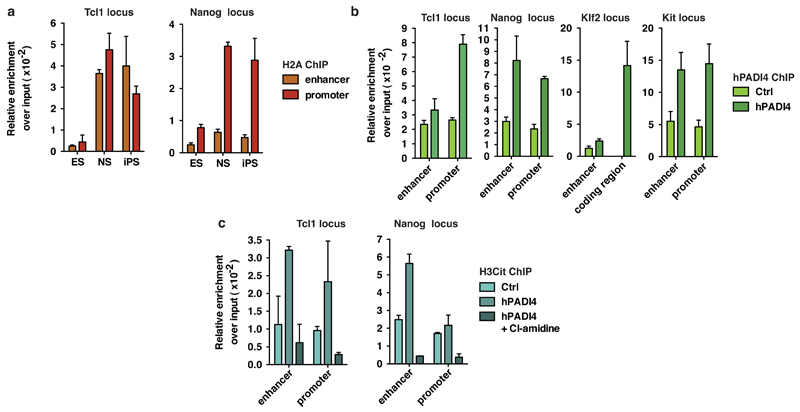
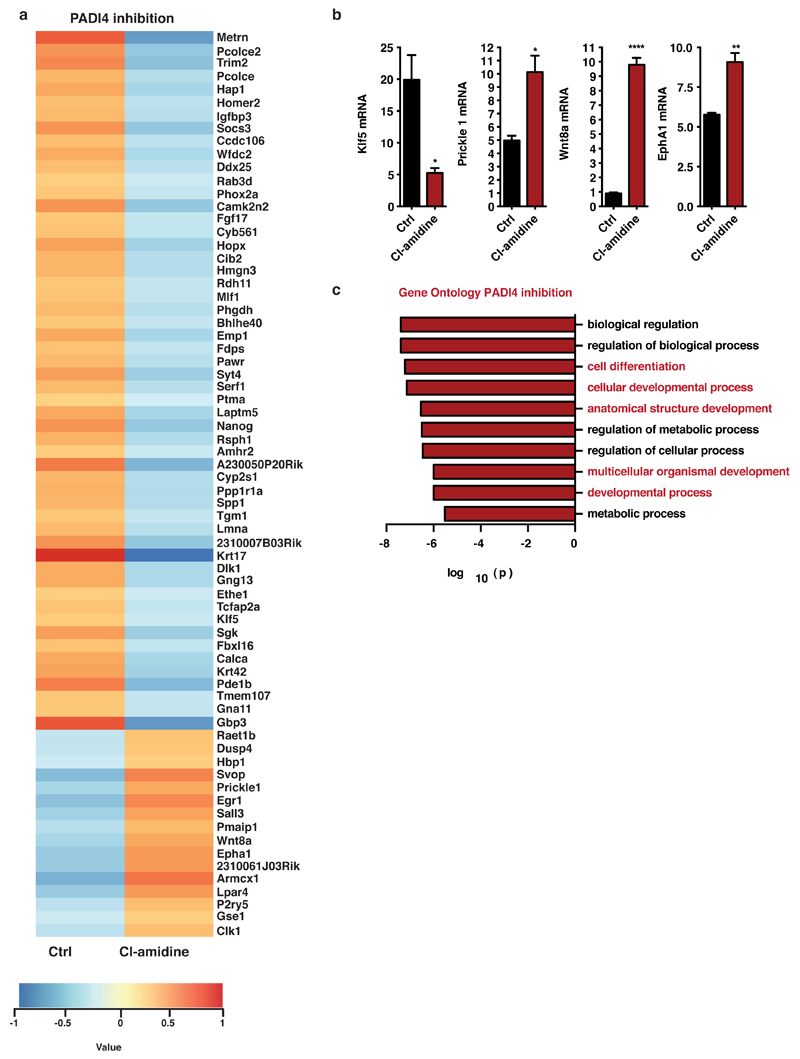
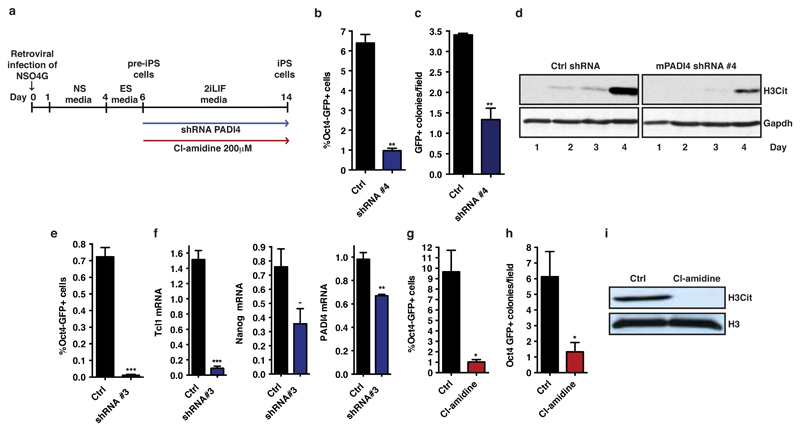
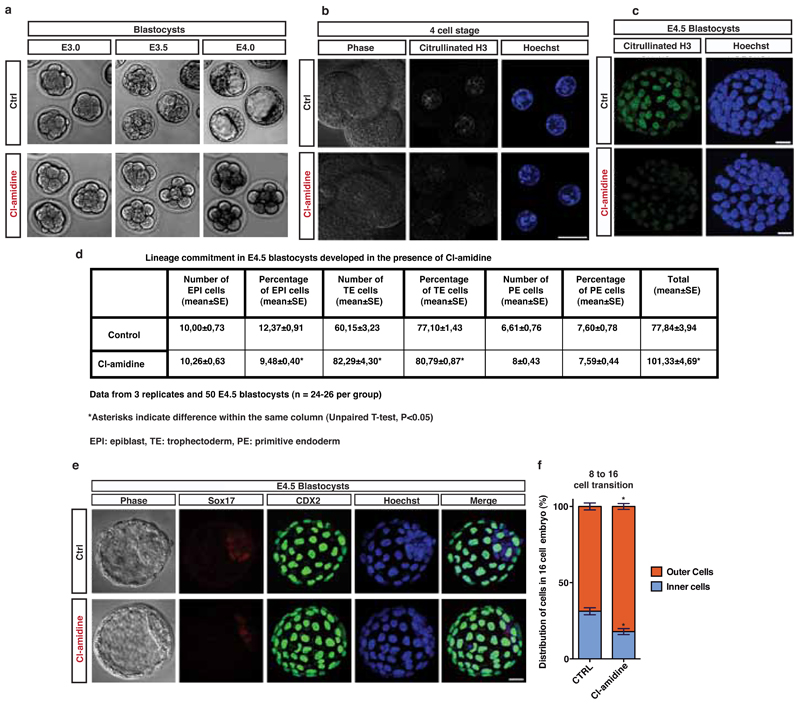
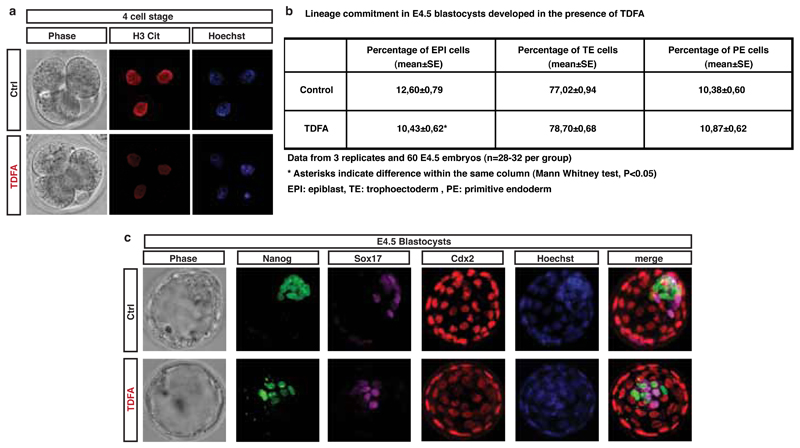
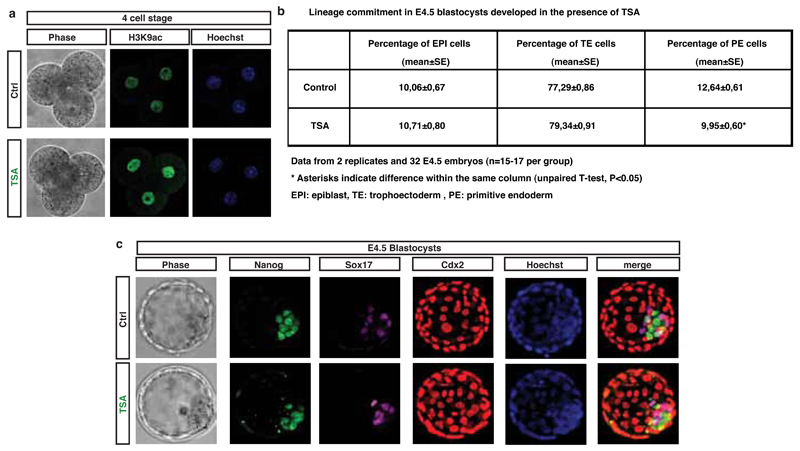
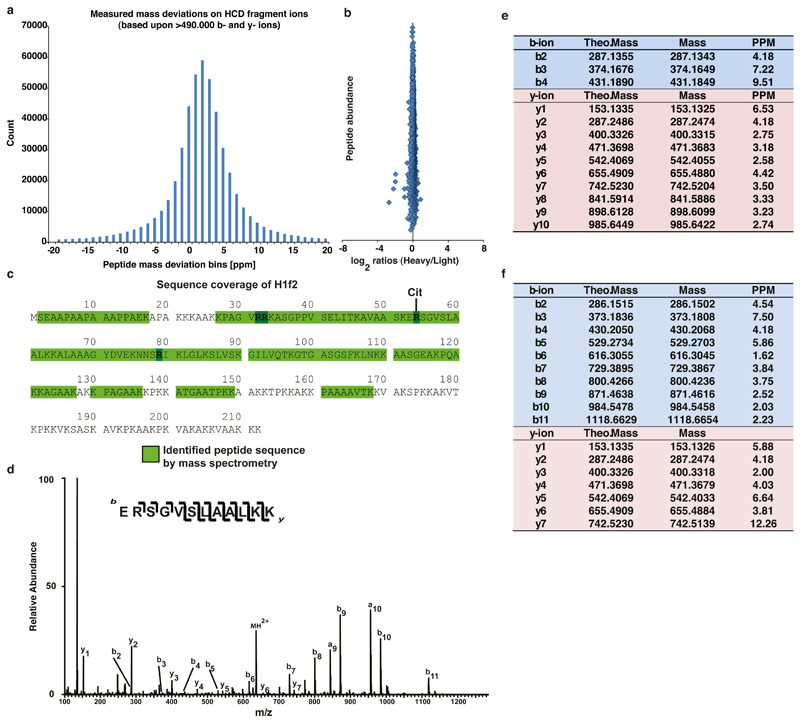
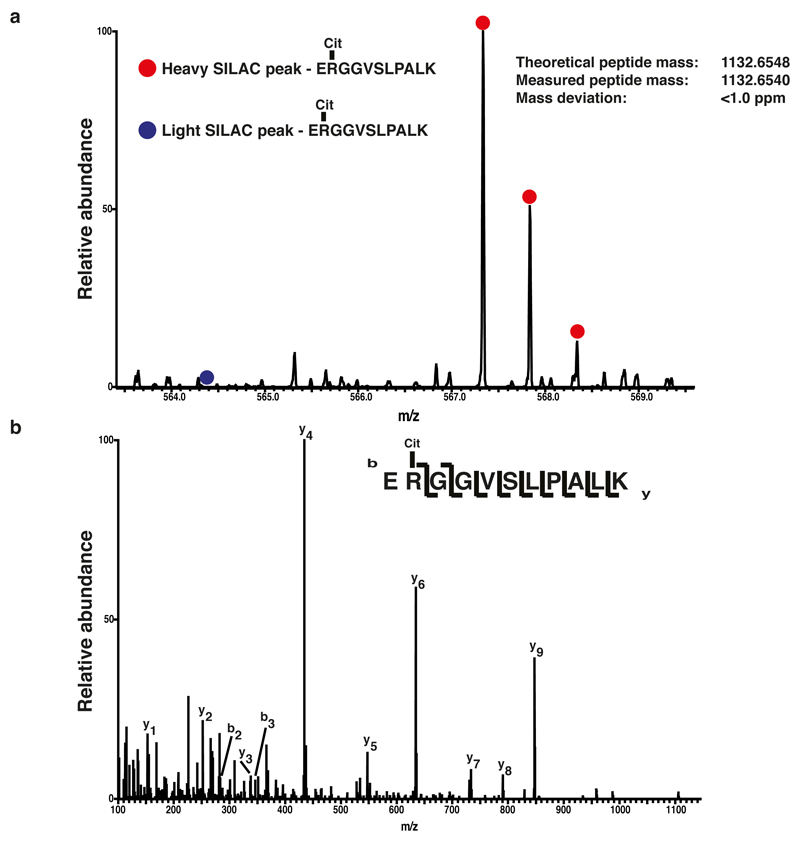
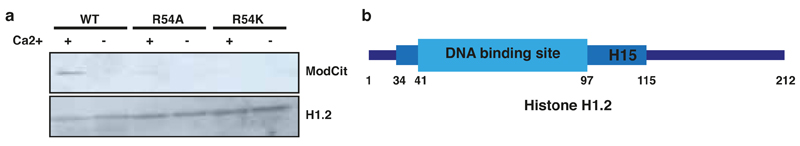
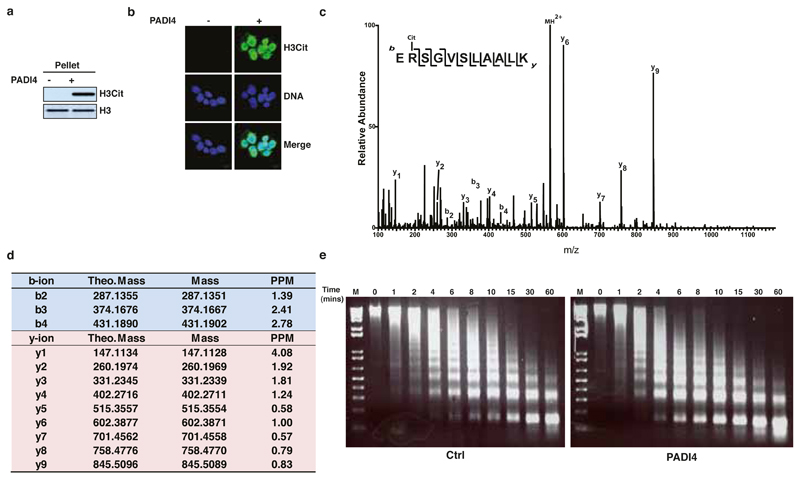
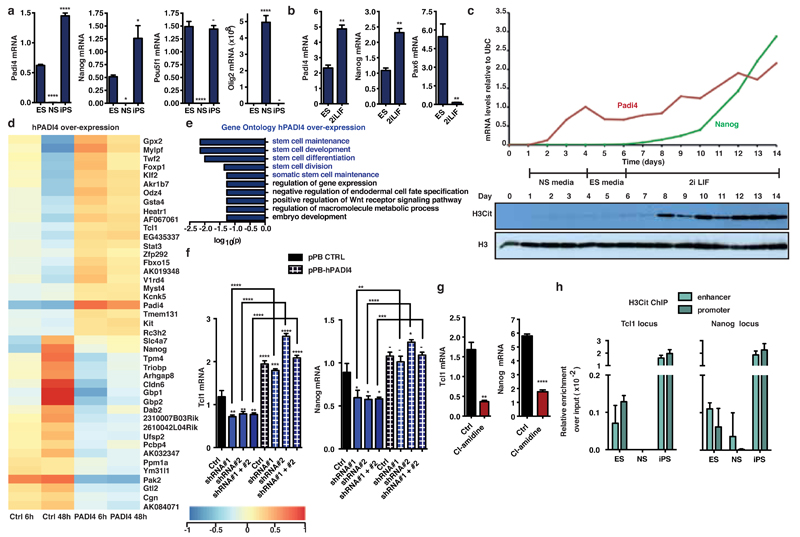
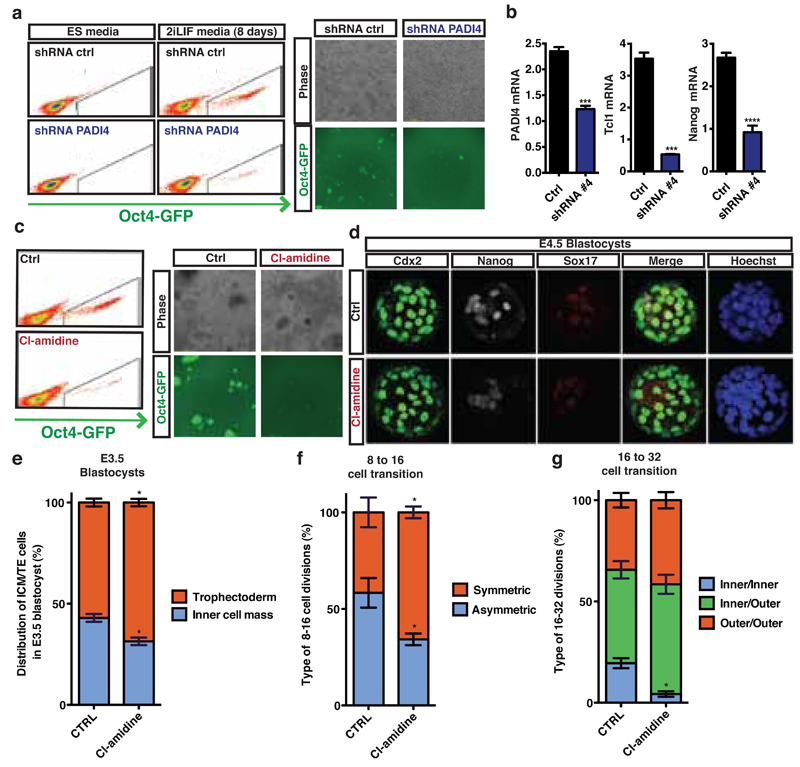
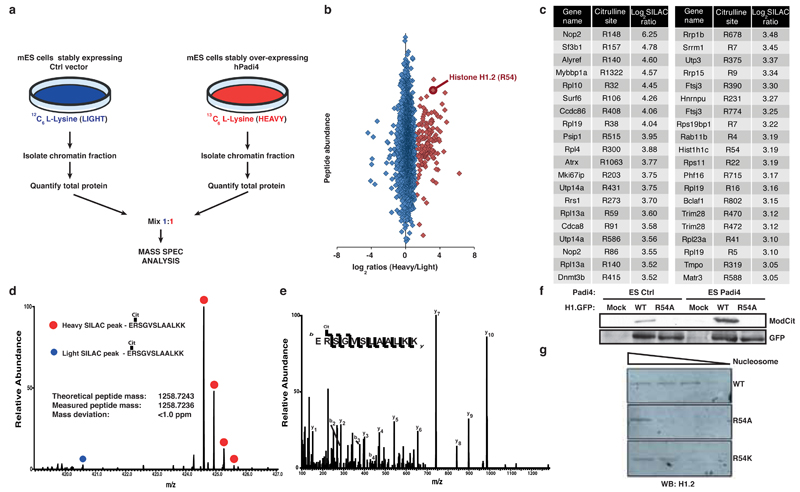
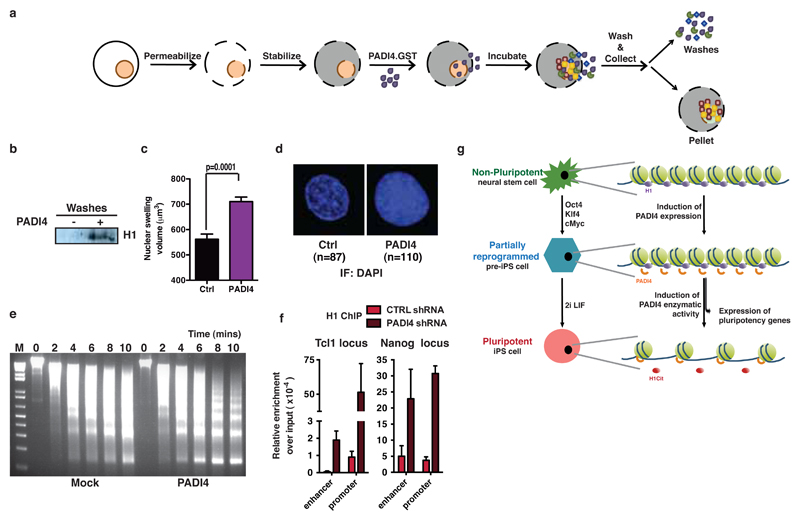
Citrullination is the post-translational conversion of an arginine residue within a protein to the non-coded amino acid citrulline. This modification leads to the loss of a positive charge and reduction in hydrogen-bonding ability. It is carried out by a small family of tissue-specific vertebrate enzymes called peptidylarginine deiminases (PADIs) and is associated with the development of diverse pathological states such as autoimmunity, cancer, neurodegenerative disorders, prion diseases and thrombosis. Nevertheless, the physiological functions of citrullination remain ill-defined, although citrullination of core histones has been linked to transcriptional regulation and the DNA damage response. PADI4 (also called PAD4 or PADV), the only PADI with a nuclear localization signal, was previously shown to act in myeloid cells where it mediates profound chromatin decondensation during the innate immune response to infection. Here we show that the expression and enzymatic activity of Padi4 are also induced under conditions of ground-state pluripotency and during reprogramming in mouse. Padi4 is part of the pluripotency transcriptional network, binding to regulatory elements of key stem-cell genes and activating their expression. Its inhibition lowers the percentage of pluripotent cells in the early mouse embryo and significantly reduces reprogramming efficiency. Using an unbiased proteomic approach we identify linker histone H1 variants, which are involved in the generation of compact chromatin, as novel PADI4 substrates. Citrullination of a single arginine residue within the DNA-binding site of H1 results in its displacement from chromatin and global chromatin decondensation. Together, these results uncover a role for citrullination in the regulation of pluripotency and provide new mechanistic insights into how citrullination regulates chromatin compaction.


Figures

Extended Data Figure 1:
(a) Transcript levels for Padi1, Padi2 and Padi3 in ES, NS and iPS cells, as assessed by qRT-PCR. Padi6 was undetectable in all three cell types. Expression normalized to endogenous levels of Ubiquitin (UbC). Error bars represent the standard error of the mean of three biological replicates. (b) Transcript levels of Padi1, Padi2 and Padi3 in ES cells upon switch to 2i containing medium for one passage, as assessed by qRT-PCR. Padi6 was undetectable in both conditions. Expression normalized to UbC. Error bars represent the standard error of the mean of three biological replicates. (c) Immunoblot analysis of H3Cit levels in ES, NS and iPS cells. Total H3 is presented as loading control. (d) Immunoblot analysis of total citrullination the levels in ES, NS and iPS cells, using an antibody against Modified Citrulline (ModCit) which recognizes peptidylcitrulline irrespective of amino acid sequence. Total H3 is presented as loading control. (e) ZHBTc4.1 and 2TS22C ES cell lines were treated with 1µg/ml doxycycline for 48 hours, resulting in depletion of Oct4 or Sox2 (data not shown). Padi4 mRNA was significantly reduced upon Oct4, but not Sox2 knockdown, as assessed by qPCR. Error bars represent standard error of the mean of four biological replicates. (f) ChIP-qPCR for Oct4, Sox2, Klf4, RNA polymerase II (PolII), H3K4me3 and H2A on the promoter of Padi4 in mES and NS cells. For each cell condition, the signal is presented as fold enrichment over Input and after subtracting background signal from the beads. Error bars represent the standard deviation of three technical qPCR replicates. Asterisks denote difference with ES cells (a) or media (b), and 0h time point (e); - not significant, * P≤0.05, ** P≤0.01, *** P≤0.001, **** P≤0.0001 by ANOVA (a) or t-test (b,e).
Extended Data Figure 2:
(a) Validation of selected targets from the PADI4 over-expression microarray dataset by qRT-PCR. Expression of Pou5f1, Sox2, Klf4 and c-Myc is not affected by PADI4 over-expression. Expression normalised to UbC. Error bars presented as standard error of the mean of three biological replicates. (b) Transcript levels of mouse Padi4 and human PADI4 in mES cells after transient knock-down with Padi4 or control (Ctrl) shRNA, and over-expression of human PADI4 or control vector (pPB CTRL), as assessed by qRT-PCR. Expression normalized to UbC. Error bars represent the standard error of the mean of three biological replicates. (c) Transcript levels of mouse Padi4, Tcl1 and Nanog in mES cell clones stably expressing Padi4 or control (Ctrl) shRNA, as assessed by qRT-PCR. Expression normalized to UbC. Error bars represent the standard error of the mean of three biological replicates. Asterisks denote difference with Ctrl (a,b,c) and between samples (b); - not significant, * P≤0.05, ** P≤0.01, *** P≤0.001, **** P≤0.0001 by ANOVA (b) or t-test (a,c).
Extended Data Figure 3:
(a) Representative ChIP-qPCR for H2A on regulatory regions of Tcl1 and Nanog in mES, NS and iPS cells (corresponding to Fig. 1h). For each cell condition, the signal is presented as fold enrichment over Input and after subtracting background signal from the beads. Error bars represent the standard deviation of three technical qPCR replicates. (b) ChIP-qPCR for hPADI4 on regulatory regions of Tcl1, Nanog, Klf2 and Kit, which are up-regulated by hPADI4 over-expression, in mES cells stably expressing hPADI4. For each cell condition, the signal is presented as fold enrichment over Input and after subtracting background signal from the beads. Error bars represent the standard deviation of three technical qPCR replicates. (c) Representative ChIP-qPCR for H3Cit on regulatory regions of Tcl1 and Nanog in mES cells stably expressing hPADI4 and treated with 200μM Cl-amidine for 48h. For each cell condition, the signal is presented as fold enrichment over Input and after subtracting background signal from the beads. Error bars represent the standard deviation of three technical qPCR replicates.
Extended Data Figure 4:
(a) Heat map of the top 70 genes that showed differential expression after PADI4 inhibition in ES cells by with 200μM Cl-amidine for 48h, as determined by microarray analysis. Displayed values are normalized log intensities, minus the mean expression of the gene across the two samples. Hierarchical clustering based on correlation. (b) Validation of selected targets from the above microarray dataset by qRT-PCR. Expression normalised to UbC. Error bars presented as standard error of the mean of three biological replicates. Asterisks denote difference with Ctrl; - not significant, * P≤0.05, ** P≤0.01, *** P≤0.001, **** P≤0.0001 by t-test. (c) Gene Ontology for Biological Process (GOBP) analysis for the most regulated gene categories within the microarray dataset of Cl-amidine treatment in mES cells. P-value is corrected for multiple testing using Benjamini and Hochberg FDR.
Extended Data Figure 5:
(a) Scheme of reprogramming of neural stem cells to pluripotent state. NSO4G cells were retrovirally transduced with Oct4, Klf4 and c-Myc. After 6 days, partially reprogrammed pre-iPS cells arose. For shRNA experiments, pre-iPS cells were stably transfected with Ctrl or PADI4 shRNA and then full reprogramming was performed in the presence of 2iLIF media for 8 days. For PADI4 enzymatic inhibition, pre-iPS cells were immediately changed to 2iLIF media in the presence of the inhibitor Cl-amidine for 8 days. (b) Quantification of flow cytometry analysis for the assessment of Oct4-GFP reporter expression in a reprogramming assay using pre-iPS cells stably expressing Padi4 shRNA #4 and Ctrl shRNA. Error bars represent standard error of the mean of triplicate samples within a representative from four reprogramming experiments. (c) Quantification of Oct4-GFP positive colonies in the reprogramming assay where pre-iPS cells were Padi4 shRNA #4 versus control (see Fig. 2a), after time-lapse image acquisition with Biostation CT. Error bars represent standard error of the mean of triplicate samples within a representative reprogramming experiment. Time-lapse video in supplementary data online. (d) Immunoblot analysis of H3Cit in pre-iPS cells treated with 2i, after Padi4 knock-down (PADI4 shRNA #4) versus control cells (Ctrl shRNA). 2i-containing medium was added on day 2. Total histone H3 presented as loading control. (e) Quantification of flow cytometry analysis for the assessment of Oct4-GFP reporter expression in a reprogramming assay using pre-iPS cells stably expressing Padi4 shRNA #3 and Ctrl shRNA. Error bars represent standard error of the mean of triplicate samples. (f) qRT-PCR analysis for the expression of Tcl, Nanog and Padi4 mRNAs at the end of the above reprogramming assay (e). Error bars represent standard error of the mean of triplicate samples. (g) Quantification of flow cytometry analysis for the assessment of Oct4-GFP reporter expression in a reprogramming assay were treated with 200μM Cl-amidine. Error bars represent standard error of the mean of triplicate samples within a representative from three reprogramming experiment. (h) Quantification of Oct4-GFP positive colonies in the reprogramming assay where pre-iPS cells were treated with 200μM Cl-amidine (see Fig. 2c) after time-lapse image acquisition with Biostation CT. Error bars represent standard error of the mean of triplicate samples within a representative reprogramming experiment. (i) Immunoblot analysis for the presence of H3Cit at the end of the above reprogramming assay (g). Total histone H3 presented as loading control. Asterisks denote difference with Control; - not significant, * P≤0.05, ** P≤0.01, *** P≤0.001, **** P≤0.0001 by t-test
Extended Data Figure 6:
(a) Embryos at 2-cell stage were treated with 200µM Cl-amidine and snapshots were taken at E3.0, E3.5 and E4.0. 200μM Cl-amidine embryos arrested at 8-cell stage, while Control embryos continued development to form blastocysts. Phase contrast images are shown. (b) Embryos at 2-cell stage were treated with 10µM Cl-amidine for 12 hours, fixed and stained for H3Cit at the 4-cell stage. Phase contrast, H3Cit (white) and HOECHST 33342 (blue) images are shown. Bar represents 20µm. (c) Embryos at E3.5 were treated with 10µM Cl-amidine for 24 hours, fixed and stained for H3Cit at E4.5. H3Cit (green) and HOECHST 33342 (blue) images are shown. Bar represents 20µm. (d) Table with quantifications of lineage commitment in E4.5 blastocysts treated with 10µM Cl-amidine from the 2-cell stage. Asterisks denote difference with Control, unpaired t-test, * = p<0.05. n=3 (50 embryos). (e) Embryos were cultured in medium supplemented with 10µM Cl-amidine from 2-cell stage and through preimplantation development. E4.5 blastocysts were fixed and stained for SOX17 (primitive endoderm marker, red), Cdx2 (trophectoderm marker, green) and HOECHST 33342 (blue). Bar represents 20µm. (f) Time-lapse analysis of distribution of inner and outer cells at the 8 to 16-cell transition, upon culturing of embryos with medium containing 10µM Cl-amidine from 2-cell stage. Error bars represent standard error of the mean. Statistical significance was determined by unpaired t-test or Mann Whitney test upon non-normal distribution. Asterisks denote difference with Control; * P≤0.05.
Extended Data Figure 7:
(a) Embryos at 2-cell stage were treated with 100µM TDFA for 12 hours and fixed and stained for H3Cit at 4-cell stage. H3Cit and HOECHST 33342 images are shown. (b) Table representing the percentage of cells committed to each embryonic lineage in E4.5 blastocysts upon treatment of embryos at 2-cell stage with 100µM TDFA. Bars represent mean percentage (±SEM). Asterisks denote difference with Control, Mann-Whitney test, * = p<0.05. n=3 (60 embryos). (c) Embryos at 2-cell stage were treated with 100µM TDFA and fixed at embryonic day E4.5. Phase contrast, Nanog (green), Sox17 (purple), Cdx2 (red) and HOECHST 33342 (blue) images are shown.
Extended Data Figure 8:
(a) Embryos at 2-cell stage were treated with 10nM TSA for 12 hours, and fixed and stained for H3K9ac at 4-cell stage. H3K9ac and HOECHST 33342 images are shown. (b) Table representing the percentage of cells committed to each embryonic lineage in E4.5 blastocysts upon treatment of embryos at 2-cell stage with 10nM TSA. Bars represent mean percentage (±SEM). Asterisks denote difference with Control, unpaired t-test, * = p<0.05. n=2 (32 embryos). (c) Embryos at 2-cell stage were treated with 10nM TSA and fixed at embryonic day E4.5. Phase contrast, Nanog (green), Sox17 (purple), Cdx2 (red) and HOECHST 33342 (blue) images are shown.
Extended Data Figure 9:
(a) Histogram demonstrating the mass accuracies of all fragment ion masses used for identifying citrullinated peptides in our HCD MS/MS spectra. >490.000 y- and b-ion masses are depicted. The average absolute mass accuracy for all of these fragment ions is 3.97 ppm. (b) Scatter plot representing SILAC ratios in ES cells cultured in 13C6 L-Lysine (HEAVY) and LIGHT medium separately, to assess extend and quality of SILAC labeling. No significant outliers are observed, indicating equal labeling. (c) Peptide coverage of histone H1 by LC-MS analysis. Detected peptides are highlighted in light green and cover >60% of H1. While all arginine residues of Histone H1 (highlighted in dark green) were accounted for by the analysis, Arg54 was the only one found citrullinated. (d) Fragmentation spectra of the unmodified LysC peptide ERSGVSLAALKK surrounding Arginine 54 of H1.2 (unmodified counterpart of citrullinated peptide depicted in Fig. 3d). The y and b series indicate fragments at amide bonds of the peptide. (e) Fragment ion table (expected and observed masses for detected y and b ions) for the identified H1R54 citrullination of peptide ERSGVSLAALKK on histone H1.2 (as shown in Fig. 3d). All measured fragment ions were detected with mass accuracies <10ppm, unambiguously identifying that the detected peptide sequence harbors a citrullination at position R54. (f) Theoretical and measured b- and y-ion fragment masses for the corresponding unmodified and heavy SILAC labeled H1.2 peptide, as presented in (d) above.
Extended Data Figure 10:
(a) MS spectrum of Histone H1.5 in a SILAC proteomic screen for identification of PADI4 substrates. Linker histone H1.5 is deiminated by PADI4, as identified by a highly increased SILAC ratio of the heavy labeled identified peptide (marked by a red dot). (b) Fragmentation spectra of the doubly charged LysC peptide ERGGVSLPALK surrounding Arginine 54 of H1.5. The y and b series indicate fragments at amide bonds of the peptide, unambiguously verifying the citrullinated peptide.
Extended Data Figure 11:
(a) Mutation of R54 renders histone H1.2 refractory to deimination. Immunoblot analysis of recombinant histone H1.2 using an antibody that detects all deimination events (ModCit). Wild type and R54-mutant H1.2 were treated with recombinant PADI4, in the presence of activating calcium. Only wild-type H1.2 can be deiminated, indicating that R54 is the only substrate of PADI4 in H1.2. No-calcium reactions presented as negative controls. Total H1.2 presented as loading control. (b) Schematic representation of the position of R54 within the globular domain linker histone H1.2.
Extended Data Figure 12:
(a) Immunoblot analysis of the “Pellet” fraction of C2C12 permeabilised cells treated with recombinant PADI4. Presence of H3Cit species indicates PADI4 activity. Total H3 is presented as a control for equal use of starting material in the two experimental conditions. (b) Immunofluorescence analysis of C2C12 nuclei after treatment with recombinant PADI4. Presence of H3Cit species indicates PADI4 activity. DNA is visualised by staining with DAPI. (c) Fragmentation spectra of the citrullination site R54 on the evicted H1.2 peptide ERSGVSLAALK (corresponding to Fig. 4b). The evicted Histone H1 is citrulinated at R54. (d) Theoretical and measured b- and y-ion fragment masses for the citrullinated H1.2 peptide (peptide sequence ERSGVSLAALK) evicted after treatment of C2C12 cells with recombinant hPADI4 (corresponding to Fig. 4b). (e) Micrococcal nuclease digestion of C2C12 nuclei after treatment with recombinant PADI4, as described in Fig. 4a. M= size marker.
Figure 1:
Figure 1:. PADI4 expression and activity are features of pluripotent cells
(a,b) qRT-PCR for Padi4 and Nanog expression in ES, NS and iPS cells (a), and in ES cells upon culture in 2i/LIF for one passage (b). Pou5f1, Olig2 and Pax6 are presented as controls. Expression normalized to Ubiquitin (UbC). Error bars: standard error of the mean of three biological replicates. (c) qRT-PCR for Padi4 and Nanog expression and H3Cit immunoblot during the course of reprogramming (see also Extended Data Fig. 5a). Loading control: total histone H3. Representative of four experiments. (d) Heat map of the genes regulated upon hPADI4 over-expression in mES cells, as determined by microarray analysis. Displayed values are normalized log intensities, minus the mean expression of the gene across the four samples. Hierarchical clustering based on correlation. (e) Gene Ontology for Biological Process (GOBP) analysis of the above microarray dataset. P- value is corrected for multiple testing using Benjamini and Hochberg False Discovery Rate (FDR). (f,g) qRT-PCR for Tcl1 and Nanog expression in mES cells after transient knock-down with Padi4 or control (Ctrl) shRNAs, and over-expression of human PADI4 or control vector (pPB CTRL) (f), and after treatment with 200µM Cl-amidine (g). Expression normalized to UbC. Error bars: standard error of the mean of three biological replicates. (h) ChIP-qPCR for H3Cit on regulatory regions of Tcl1 and Nanog in mES, NS and iPS cells. Error bars: standard deviation of three technical qPCR replicates. Representative of three experiments. Asterisks denote difference with ES cells (a) or media (b), Control (f, g) and between samples (f); - not significant, * P≤0.05, ** P≤0.01, *** P≤0.001, **** P≤0.0001, by ANOVA (a,f) or t-test (b,g).
Figure 2:
Figure 2:. Citrullination and PADI4 regulate pluripotency during reprogramming and early embryo development
(a) Flow cytometry analysis and phase contrast/fluorescence images for the assessment of Oct4-GFP reporter expression after reprogramming of pre-iPS cells stably expressing Padi4 and Ctrl shRNAs. Representative of four independent experiments. Time-lapse video in supplementary data online. (b) qRT-PCR for expression of Tcl1, Nanog and Padi4 at the end of the above reprogramming assay. Error bars: standard error of the mean of triplicate samples. (c) Flow cytometry analysis and phase contrast/fluorescence images for the assessment of Oct4-GFP reporter expression after reprogramming assay of pre-iPS cells treated with 200µM Cl-amidine. Representative of three independent experiments. (d) E4.5 blastocysts from 2-cell stage embryos treated with 10µM Cl-amidine. SOX17 (primitive endoderm marker, red), Cdx2 (trophectoderm marker, green), Nanog (epiblast marker, white) and HOECHST 33342 (blue). (e) Distribution of inner cell mass versus trophectoderm cells in E3.5 blastocyst treated as above. (f,g) Time-lapse analysis of embryos in 10µM Cl-amidine from 2-cell stage. Number of symmetric versus asymmetric divisions at the 8 to 16-cell transition (f) and type of divisions at the 16 to 32-cell transition (g). Error bars: standard error of the mean. Statistical significance was determined by unpaired t-test (b), or Mann Whitney test upon non-normal distribution (e-g). Asterisks denote difference with Control; - not significant, * P≤0.05, ** P≤0.01, *** P≤0.001, **** P≤0.0001.
Figure 3:
Figure 3:. PADI4 citrullinates Arg54 on linker histone H1 and affects its binding to nucleosomal DNA
(a) Experimental strategy for screening for PADI4 citrullination substrates in the chromatin fraction of ES cells. (b) Scatter plot representing the overall fold change for all identified citrullination sites. Red diamonds: PADI4-regulated citrullinations. (c) Table representing the 40 most highly regulated PADI4 substrates, their individual citrullination sites and the log2 SILAC ratio. Complete dataset in Supplementary Table 4. (d) Quantification of citrullination site R54 on H1.2 through differential regulation of the triply charged peptide ERSGVSLAALKK. (e) Fragmentation spectra of the triply charged and heavy SILAC labeled LysC peptide ERSGVSLAALKK surrounding Arginine 54 of H1.2. The y and b series indicate fragments at amide bonds of the peptide. (f) Citrullination immunoblot of wild-type and R54A mutant GFP-tagged H1.2 expressed and pulled-down from ES cells expressing PADI4 or control vector (Mock). Control for the efficiency of the pull-down: GFP. (g) Nucleosome pull-down assay using wild-type and R54-mutant H1.2. WB: Western Blot.
Figure 4:
Figure 4:. PADI4 evicts histone H1 from chromatin and affects chromatin condensation
(a) Schematic representation of treatment of C2C12 myoblast nuclei with recombinant PADI4. (b) Immunoblot analysis of the wash fraction after the above treatment, for histone H1.2. (c,d) Quantification of nuclear volume (c) and representative DAPI fluorescence (d) upon treatment of permeabilized C2C12 nuclei with recombinant PADI4. Error bars: standard error of the mean. Statistical significance determined by unpaired student t-test. (e) Micrococcal nuclease digestion of C2C12 cells overexpressing an empty vector (Mock) or hPADI4. (f) ChIP-qPCR for H1.2 on the regulatory regions of Tcl1 and Nanog in mES cells stably expressing Padi4 or Ctrl shRNA. Error bars: standard error of the mean of three technical qPCR replicates. Representative of two experiments. (g) Proposed model for the role of PADI4 in the regulation of pluripotency.

References

    1. Vossenaar ER, Zendman AJ, van Venrooij WJ, Pruijn GJ. PAD, a growing family of citrullinating enzymes: genes, features and involvement in disease. BioEssays: news and reviews in molecular, cellular and developmental biology. 2003;25:1106–1118. doi: 10.1002/bies.10357. - DOI - PubMed
    1. Wang S, Wang Y. Peptidylarginine deiminases in citrullination, gene regulation, health and pathogenesis. Biochim Biophys Acta. 2013;1829:1126–1135. doi: 10.1016/j.bbagrm.2013.07.003. - DOI - PMC - PubMed
    1. Martinod K, et al. Neutrophil histone modification by peptidylarginine deiminase 4 is critical for deep vein thrombosis in mice. Proc Natl Acad Sci U S A. 2013;110:8674–8679. doi: 10.1073/pnas.1301059110. - DOI - PMC - PubMed
    1. Hagiwara T, Nakashima K, Hirano H, Senshu T, Yamada M. Deimination of arginine residues in nucleophosmin/B23 and histones in HL-60 granulocytes. Biochemical and biophysical research communications. 2002;290:979–983. doi: 10.1006/bbrc.2001.6303. - DOI - PubMed
    1. Cuthbert GL, et al. Histone deimination antagonizes arginine methylation. Cell. 2004;118:545–553. doi: 10.1016/j.cell.2004.08.020. - DOI - PubMed

Publication types

MeSH terms