

CNS expression of murine fragile X protein (FMRP) as a function of CGG-repeat size
- PMID: 24463622
- PMCID: PMC4030777
- DOI: 10.1093/hmg/ddu032
CNS expression of murine fragile X protein (FMRP) as a function of CGG-repeat size
Abstract
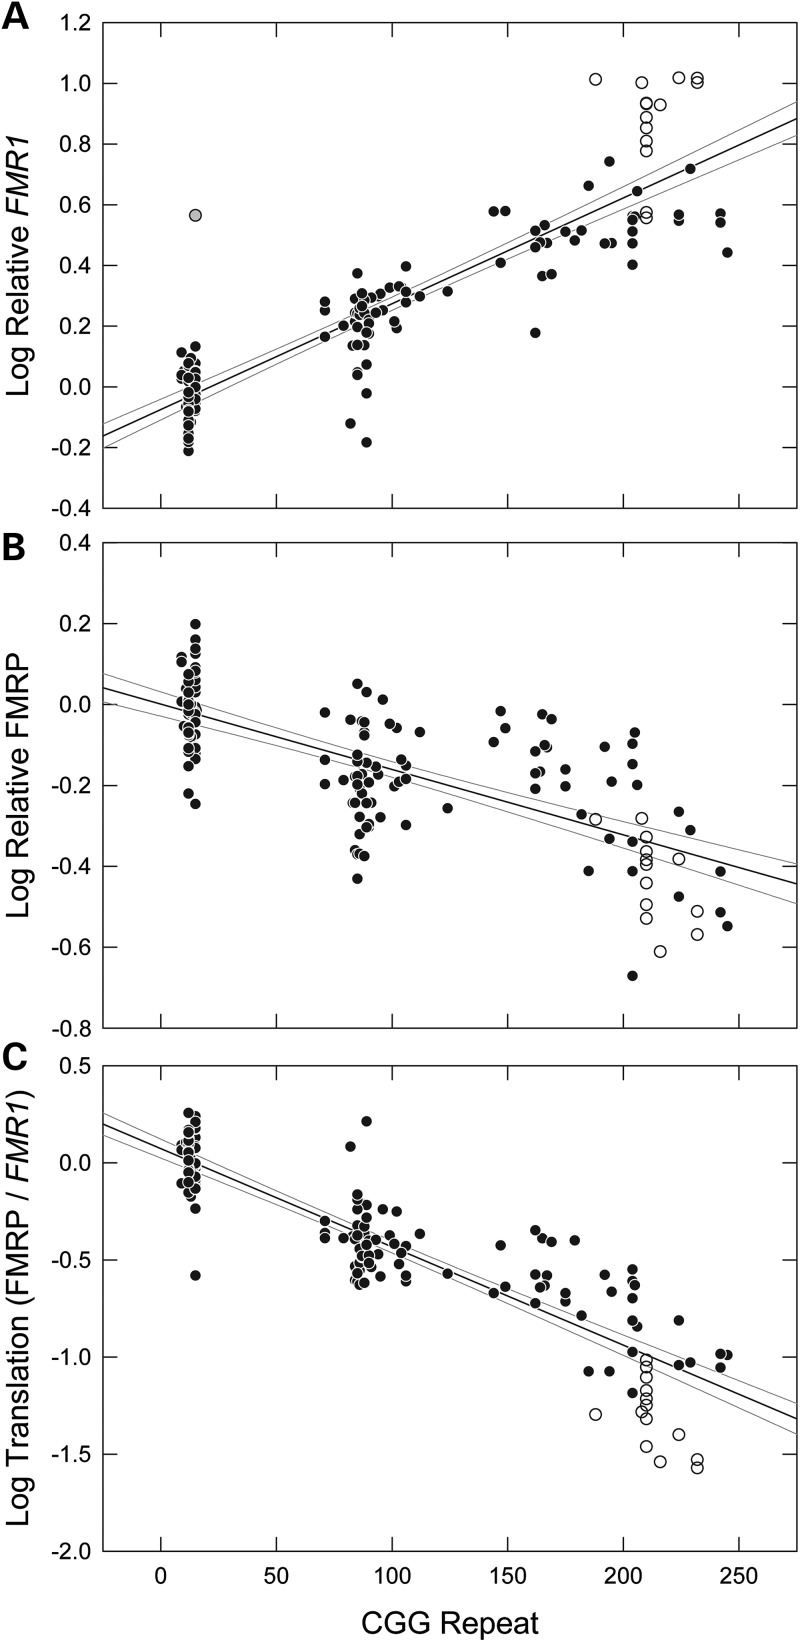
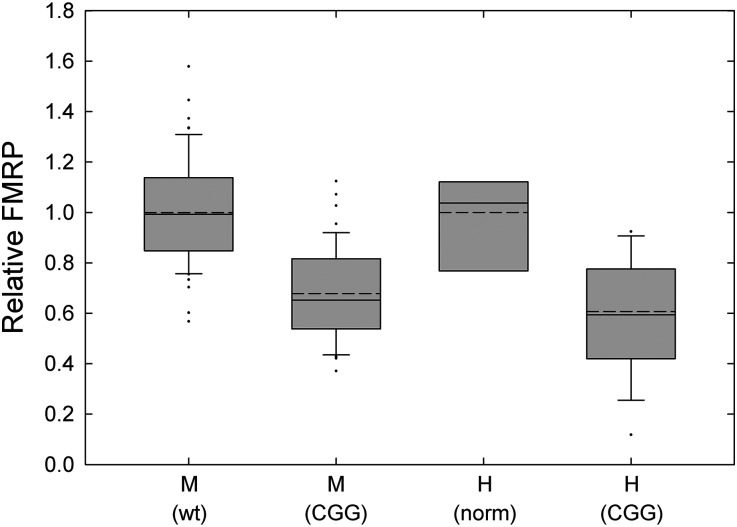
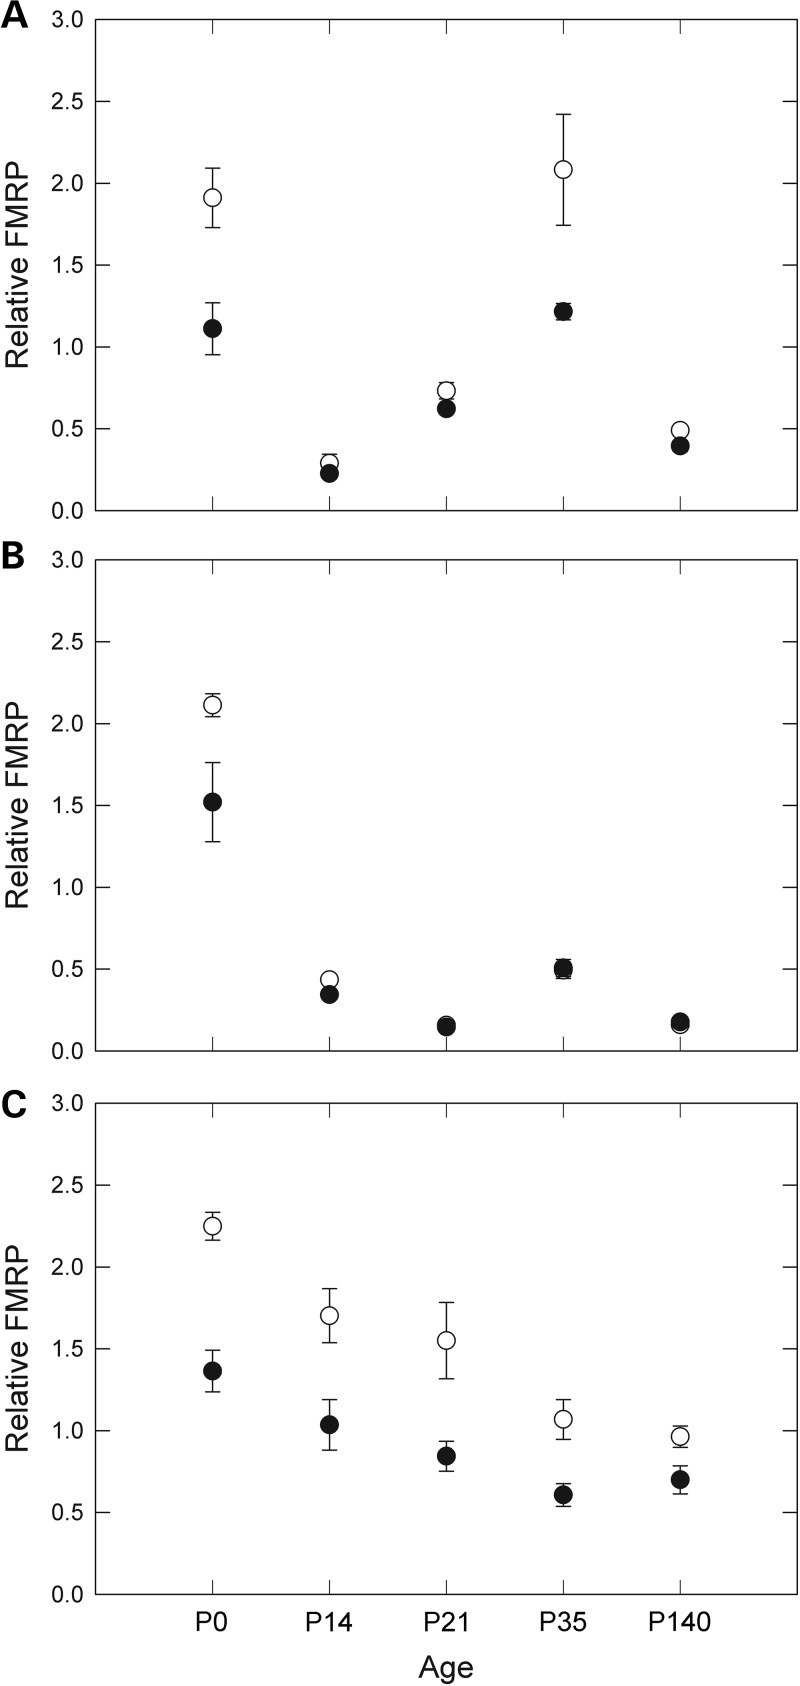
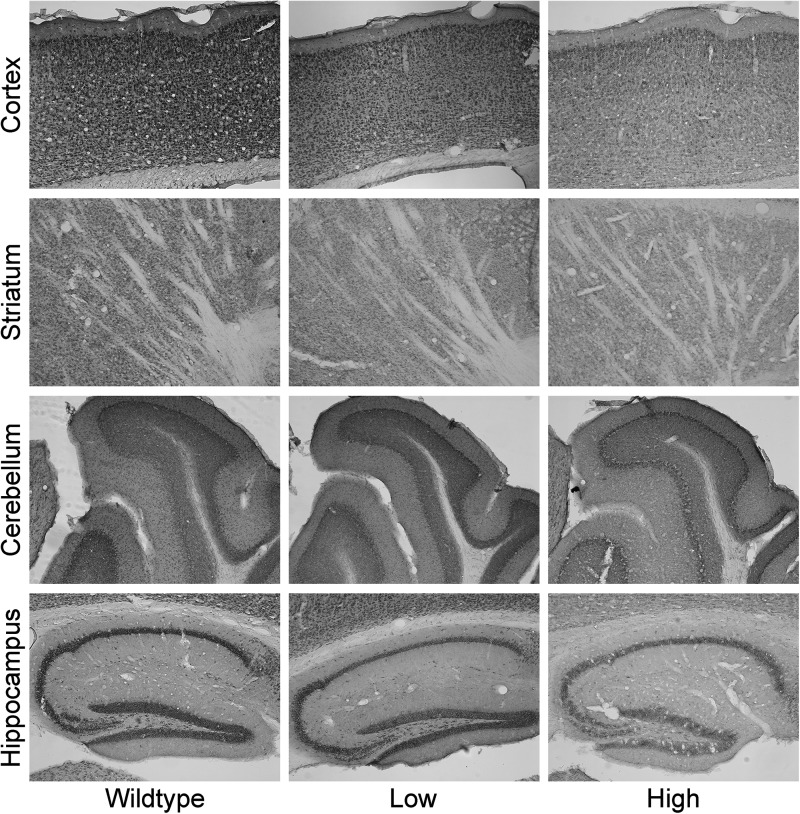
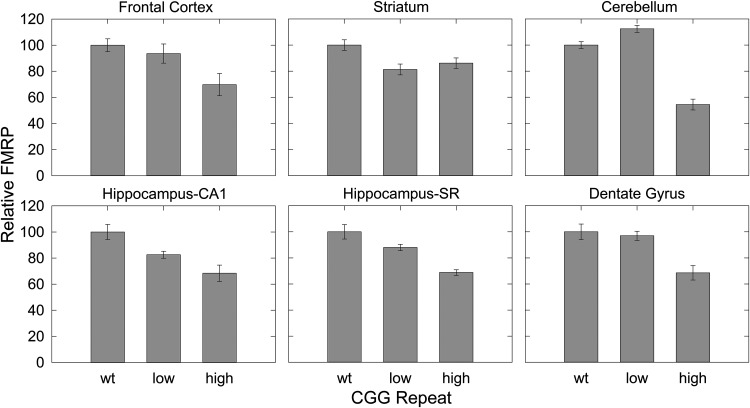
Large expansions of a CGG-repeat element (>200 repeats; full mutation) in the fragile X mental retardation 1 (FMR1) gene cause fragile X syndrome (FXS), the leading single-gene form of intellectual disability and of autism spectrum disorder. Smaller expansions (55-200 CGG repeats; premutation) result in the neurodegenerative disorder, fragile X-associated tremor/ataxia syndrome (FXTAS). Whereas FXS is caused by gene silencing and insufficient FMR1 protein (FMRP), FXTAS is thought to be caused by 'toxicity' of expanded-CGG-repeat mRNA. However, as FMRP expression levels decrease with increasing CGG-repeat length, lowered protein may contribute to premutation-associated clinical involvement. To address this issue, we measured brain Fmr1 mRNA and FMRP levels as a function of CGG-repeat length in a congenic (CGG-repeat knock-in) mouse model using 57 wild-type and 97 expanded-CGG-repeat mice carrying up to ~250 CGG repeats. While Fmr1 message levels increased with repeat length, FMRP levels trended downward over the same range, subject to significant inter-subject variation. Human comparisons of protein levels in the frontal cortex of 7 normal and 17 FXTAS individuals revealed that the mild FMRP decrease in mice mirrored the more limited data for FMRP expression in the human samples. In addition, FMRP expression levels varied in a subset of mice across the cerebellum, frontal cortex, and hippocampus, as well as at different ages. These results provide a foundation for understanding both the CGG-repeat-dependence of FMRP expression and for interpreting clinical phenotypes in premutation carriers in terms of the balance between elevated mRNA and lowered FMRP expression levels.
© The Author 2014. Published by Oxford University Press. All rights reserved. For Permissions, please email: journals.permissions@oup.com.
Figures
References
-
- Loesch D.Z., Huggins R.M., Hagerman R.J. Phenotypic variation and FMRP levels in fragile X. Ment. Retard. Dev. Disabil. Res. Rev. 2004;10:31–41. - PubMed
-
- Schneider A., Hagerman R.J., Hessl D. Fragile X syndrome -- from genes to cognition. Dev. Disabil. Res. Rev. 2009;15:333–342. - PubMed
-
- Pieretti M., Zhang F.P., Fu Y.H., Warren S.T., Oostra B.A., Caskey C.T., Nelson D.L. Absence of expression of the FMR-1 gene in fragile X syndrome. Cell. 1991;66:817–822. - PubMed
-
- Fu Y.H., Kuhl D.P., Pizzuti A., Pieretti M., Sutcliffe J.S., Richards S., Verkerk A.J., Holden J.J., Fenwick R.G., Jr, Warren S.T., et al. Variation of the CGG repeat at the fragile X site results in genetic instability: resolution of the Sherman paradox. Cell. 1991;67:1047–1058. - PubMed
Publication types
MeSH terms
Substances
Grants and funding
LinkOut - more resources
Full Text Sources
Other Literature Sources
Medical
Molecular Biology Databases
