

Prevalence and trends of symptomatic pelvic floor disorders in U.S. women
- PMID: 24463674
- PMCID: PMC3970401
- DOI: 10.1097/AOG.0000000000000057
Prevalence and trends of symptomatic pelvic floor disorders in U.S. women
Abstract
Objective: To estimate the prevalence and trends of these pelvic floor disorders in U.S. women from 2005 to 2010.
Methods: We used the National Health and Nutritional Examination Survey from 2005-2006, 2007-2008, and 2009-2010. A total of 7,924 nonpregnant women (aged 20 years or older) were categorized as having: urinary incontinence (UI)-moderate to severe (3 or higher on a validated UI severity index, range 0-12); fecal incontinence-at least monthly (solid, liquid, or mucus stool); and pelvic organ prolapse-seeing or feeling a bulge. Potential risk factors included age, race and ethnicity, parity, education, poverty income ratio, body mass index ([BMI] less than 25, 25-29, 30 or greater), comorbidity count, and reproductive factors. Using appropriate sampling weights, weighted χ analysis and multivariable logistic regression models with odds ratios and 95% confidence intervals (95% CIs) were reported.
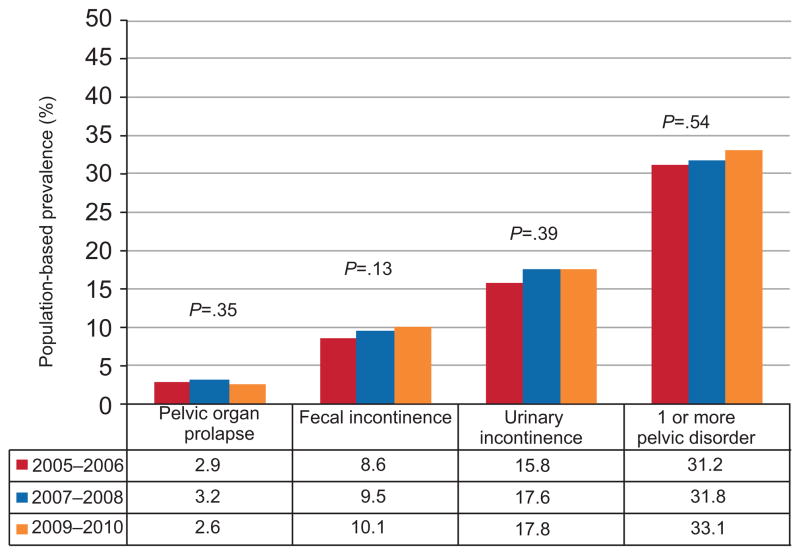
Results: The weighted prevalence rate of one or more pelvic floor disorders was 25.0% (95% CI 23.6-26.3), including 17.1% (95% CI 15.8-18.4) of women with moderate-to-severe UI, 9.4% (95% CI 8.6-10.2) with fecal incontinence, and 2.9% (95% CI 2.5-3.4) with prolapse. From 2005 to 2010, no significant differences were found in the prevalence rates of any individual disorder or for all disorders combined (P>.05). After adjusting for potential confounders, higher BMI, greater parity, and hysterectomy were associated with higher odds of one or more pelvic floor disorders.
Conclusion: Although rates of pelvic floor disorders did not change from 2005 to 2010, these conditions remain common, with one fourth of adult U.S. women reporting at least one disorder.
Level of evidence: III.
Figures
References
-
- Hendrix SL, Clark A, Nygaard I, Aragaki A, Barnabei V, McTiernan A. Pelvic organ prolapse in the Women’s Health Initiative: gravity and gravidity. Am J Obstet Gynecol. 2002 Jun;186(6):1160–6. - PubMed
-
- Swift S, Woodman P, O’Boyle A, Kahn M, Valley M, Bland D, et al. Pelvic Organ Support Study (POSST): the distribution, clinical definition, and epidemiologic condition of pelvic organ support defects. Am J Obstet Gynecol. 2005 Mar;192(3):795–806. - PubMed
-
- Ogden CL, Carroll MD, Kit BK, Flegal KM. Prevalence of obesity in the United States, 2009–2010. NCHS Data Brief. 2012 Jan;(82):1–8. - PubMed
Publication types
MeSH terms
Grants and funding
LinkOut - more resources
Full Text Sources
Other Literature Sources
Medical
Research Materials
