

Can we believe the DAGs? A comment on the relationship between causal DAGs and mechanisms
- PMID: 24463886
- PMCID: PMC5051601
- DOI: 10.1177/0962280213520436
Can we believe the DAGs? A comment on the relationship between causal DAGs and mechanisms
Abstract
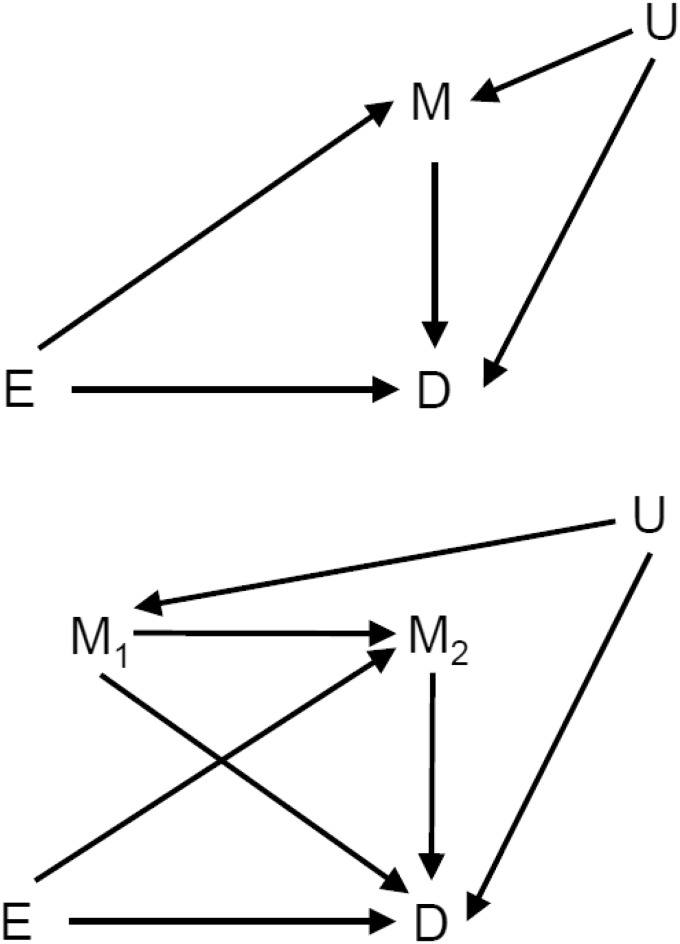
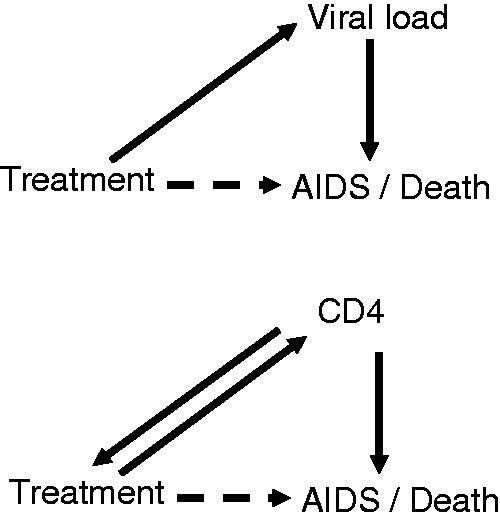
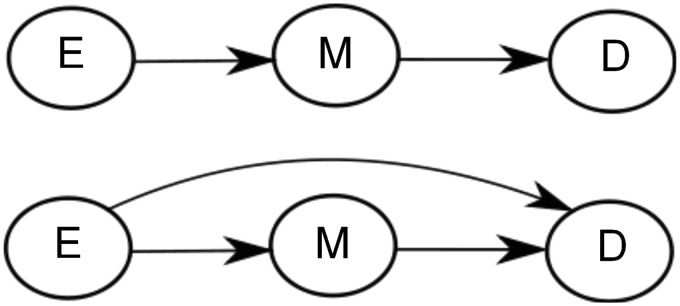
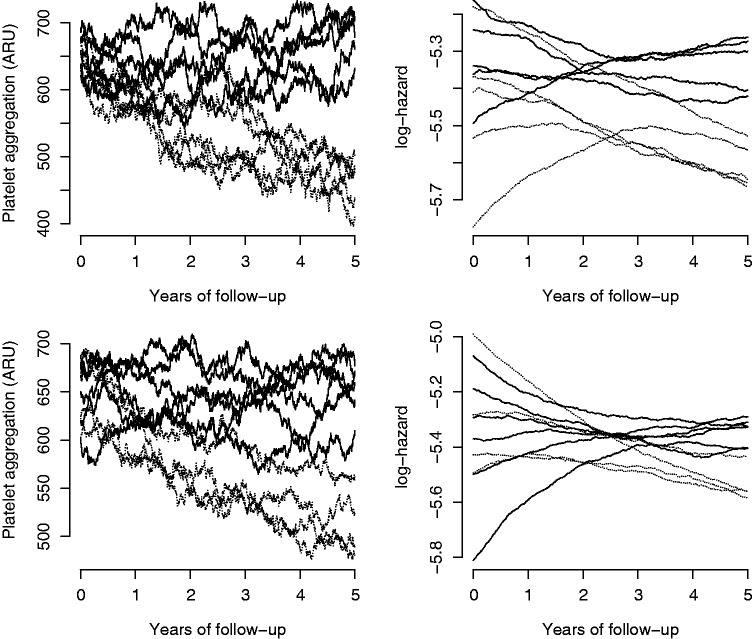
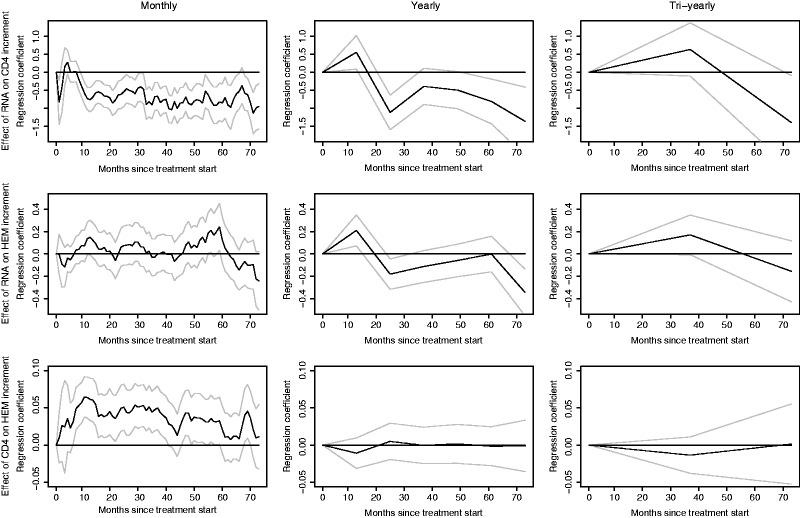
Directed acyclic graphs (DAGs) play a large role in the modern approach to causal inference. DAGs describe the relationship between measurements taken at various discrete times including the effect of interventions. The causal mechanisms, on the other hand, would naturally be assumed to be a continuous process operating over time in a cause-effect fashion. How does such immediate causation, that is causation occurring over very short time intervals, relate to DAGs constructed from discrete observations? We introduce a time-continuous model and simulate discrete observations in order to judge the relationship between the DAG and the immediate causal model. We find that there is no clear relationship; indeed the Bayesian network described by the DAG may not relate to the causal model. Typically, discrete observations of a process will obscure the conditional dependencies that are represented in the underlying mechanistic model of the process. It is therefore doubtful whether DAGs are always suited to describe causal relationships unless time is explicitly considered in the model. We relate the issues to mechanistic modeling by using the concept of local (in)dependence. An example using data from the Swiss HIV Cohort Study is presented.
Keywords: causal inference; directed acyclic graphs; mechanisms; modeling.
© The Author(s) 2014.
Figures
Similar articles
-
Causal Diagrams: Pitfalls and Tips.J Epidemiol. 2020 Apr 5;30(4):153-162. doi: 10.2188/jea.JE20190192. Epub 2020 Feb 1. J Epidemiol. 2020. PMID: 32009103 Free PMC article.
-
Evidence synthesis for constructing directed acyclic graphs (ESC-DAGs): a novel and systematic method for building directed acyclic graphs.Int J Epidemiol. 2020 Feb 1;49(1):322-329. doi: 10.1093/ije/dyz150. Int J Epidemiol. 2020. PMID: 31325312 Free PMC article.
-
[Causal Inference in Medicine Part II. Directed acyclic graphs--a useful method for confounder selection, categorization of potential biases, and hypothesis specification].Nihon Eiseigaku Zasshi. 2009 Sep;64(4):796-805. doi: 10.1265/jjh.64.796. Nihon Eiseigaku Zasshi. 2009. PMID: 19797848 Japanese.
-
Use of directed acyclic graphs (DAGs) to identify confounders in applied health research: review and recommendations.Int J Epidemiol. 2021 May 17;50(2):620-632. doi: 10.1093/ije/dyaa213. Int J Epidemiol. 2021. PMID: 33330936 Free PMC article. Review.
-
Directed acyclic graphs: a tool for causal studies in paediatrics.Pediatr Res. 2018 Oct;84(4):487-493. doi: 10.1038/s41390-018-0071-3. Epub 2018 Jun 4. Pediatr Res. 2018. PMID: 29967527 Free PMC article. Review.
Cited by
-
Bias in matched case-control studies: DAGs are not enough.Eur J Epidemiol. 2018 Jan;33(1):1-4. doi: 10.1007/s10654-018-0362-3. Epub 2018 Jan 25. Eur J Epidemiol. 2018. PMID: 29372462 No abstract available.
-
The current deconstruction of paradoxes: one sign of the ongoing methodological "revolution".Eur J Epidemiol. 2015 Oct;30(10):1079-87. doi: 10.1007/s10654-015-0068-8. Epub 2015 Jul 12. Eur J Epidemiol. 2015. PMID: 26164615
-
Causal inference on microbiome-metabolome relations in observational host-microbiome data via in silico in vivo association pattern analyses.Cell Rep Methods. 2023 Oct 23;3(10):100615. doi: 10.1016/j.crmeth.2023.100615. Epub 2023 Oct 16. Cell Rep Methods. 2023. PMID: 37848031 Free PMC article.
-
Dynamic reciprocal relationships between cognitive and functional declines along the Alzheimer's disease continuum in the prospective COGICARE study.Alzheimers Res Ther. 2021 Sep 3;13(1):148. doi: 10.1186/s13195-021-00887-4. Alzheimers Res Ther. 2021. PMID: 34479648 Free PMC article.
-
Commentary: Incorporating concepts and methods from causal inference into life course epidemiology.Int J Epidemiol. 2016 Aug;45(4):1006-1010. doi: 10.1093/ije/dyw103. Int J Epidemiol. 2016. PMID: 27880691 Free PMC article. No abstract available.
References
-
- Angiogenesis Inhibitors. http://www.cancer. gov/cancertopics/factsheet/Therapy/angiogenesis-inhibitors (2011, accessed 9 January 2014).
-
- Baron RM, Kenny DA. The moderator-mediator variable distinction in social psychological research: conceptual, strategic, and statistical considerations. J Person Social Psychol 1986; 51: 1173–1182. - PubMed
-
- Schweder T. Composable Markov processes. J Appl Probab 1970; 7: 400–410.
-
- Didelez V. Graphical models for marked point processes based on local independence. J R Stat Soc Ser B 2008; 70: 245–264.
-
- Aalen OO, Frigessi A. What can statistics contribute to a causal understanding? Scand J Stat 2007; 34: 155–168.
MeSH terms
Substances
LinkOut - more resources
Full Text Sources
Other Literature Sources
Medical
