. 2014 Mar;17(3):423-30.
doi: 10.1038/nn.3632. Epub 2014 Jan 26.

Basal ganglia subcircuits distinctively encode the parsing and concatenation of action sequences

Affiliations

Basal ganglia subcircuits distinctively encode the parsing and concatenation of action sequences

Xin Jin et al. Nat Neurosci. 2014 Mar.

Abstract

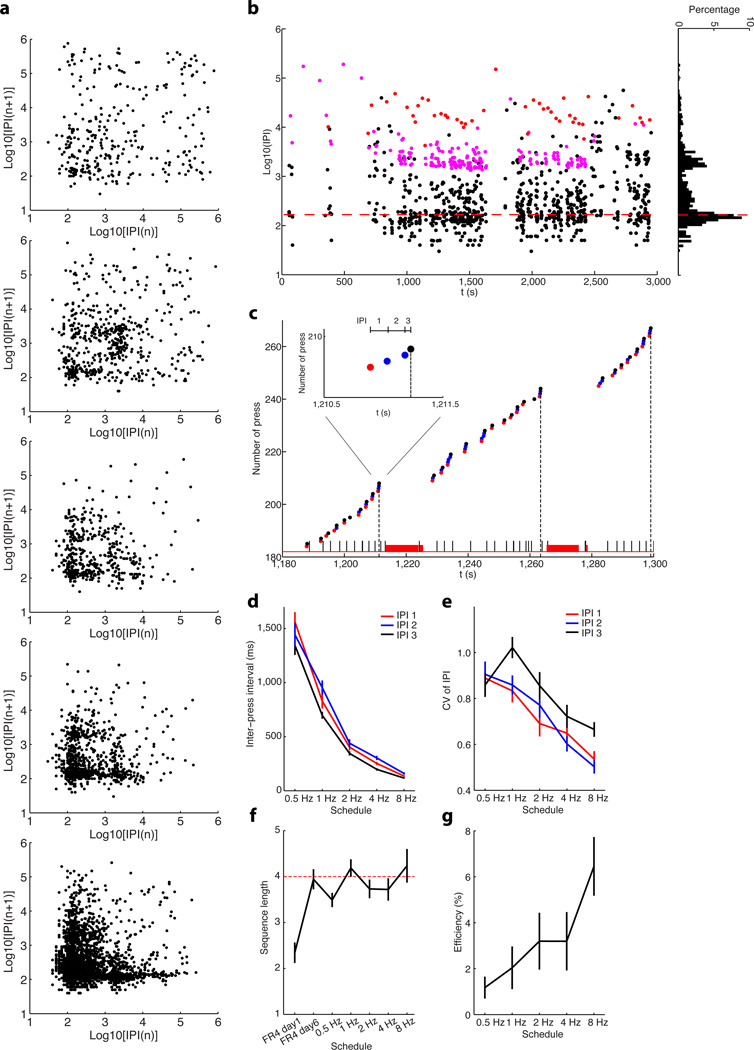
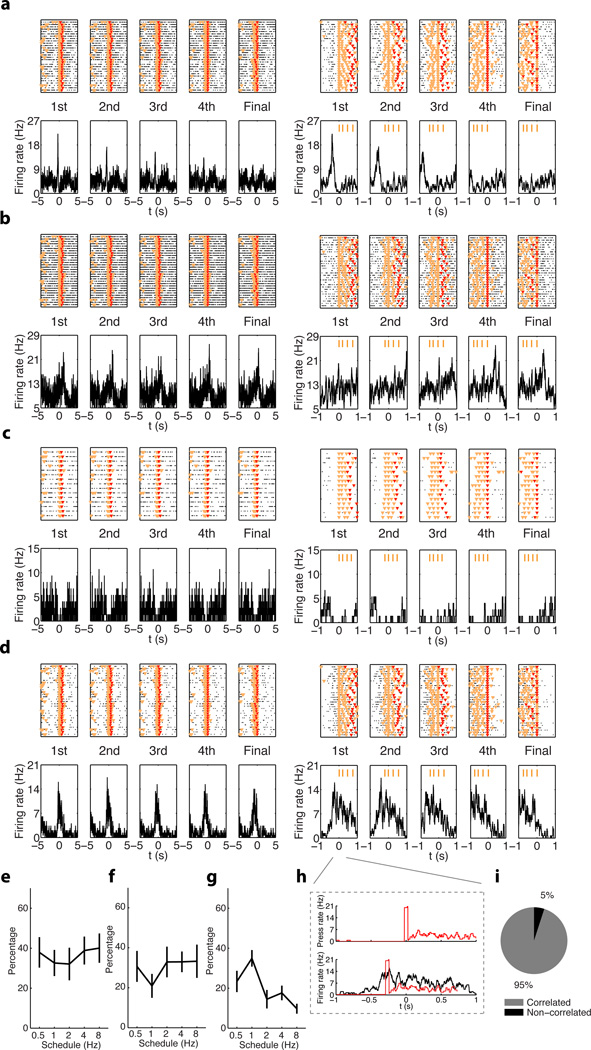
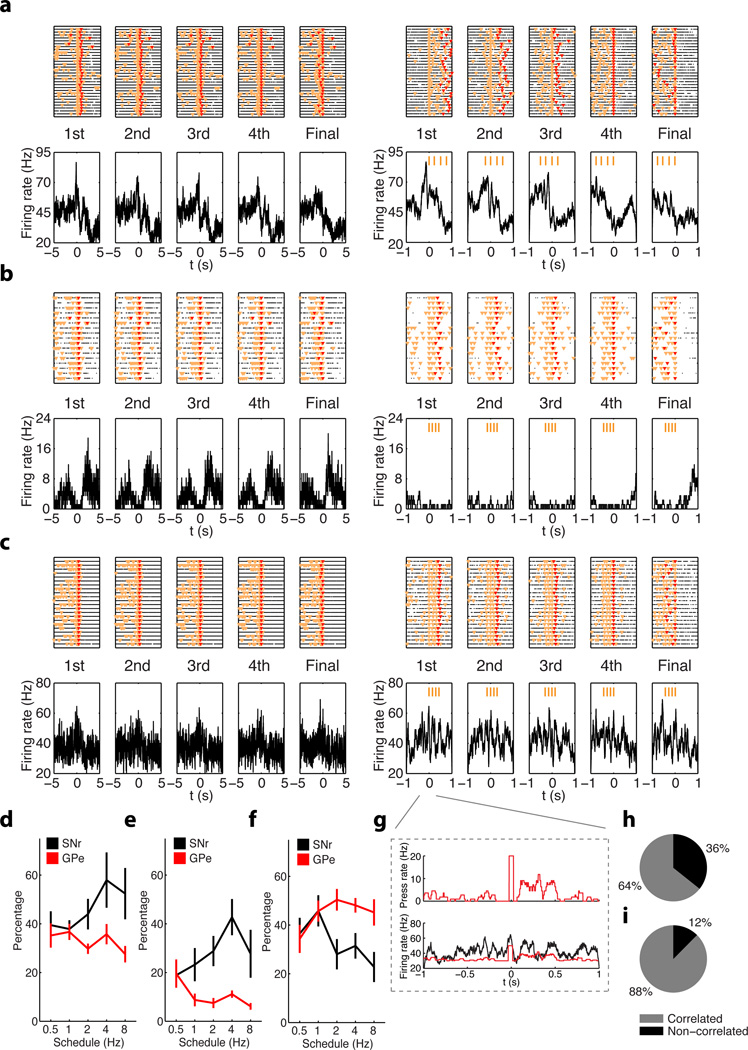
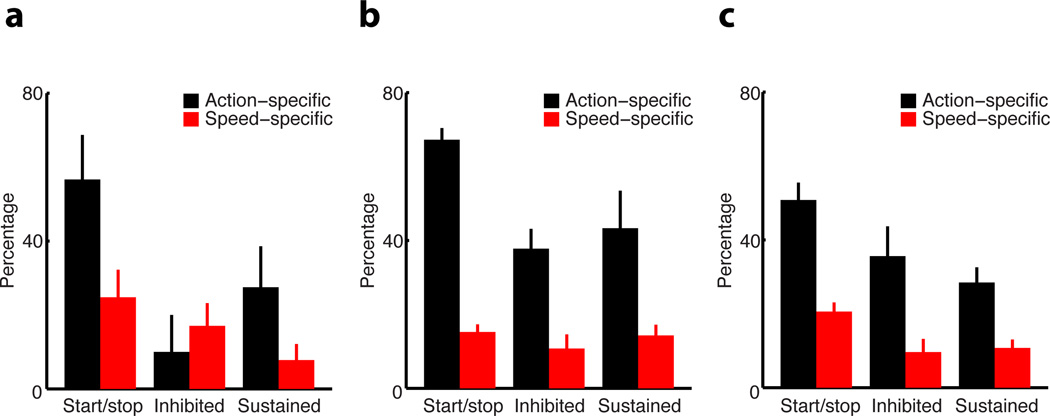
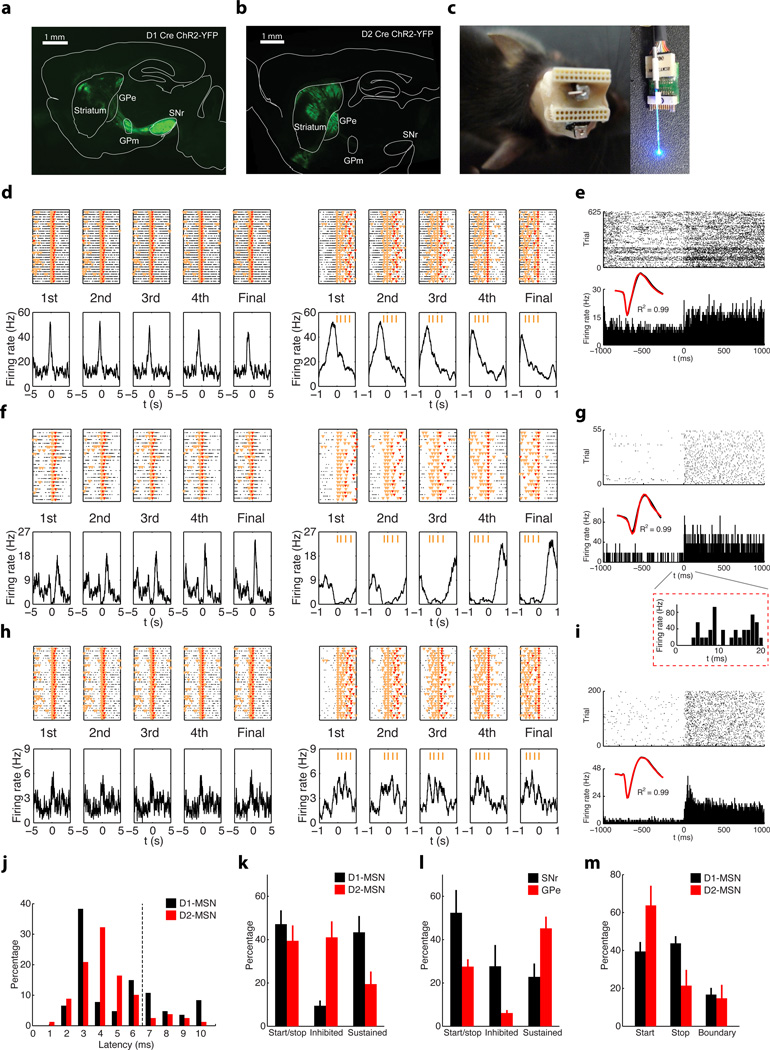
Chunking allows the brain to efficiently organize memories and actions. Although basal ganglia circuits have been implicated in action chunking, little is known about how individual elements are concatenated into a behavioral sequence at the neural level. Using a task in which mice learned rapid action sequences, we uncovered neuronal activity encoding entire sequences as single actions in basal ganglia circuits. In addition to neurons with activity related to the start/stop activity signaling sequence parsing, we found neurons displaying inhibited or sustained activity throughout the execution of an entire sequence. This sustained activity covaried with the rate of execution of individual sequence elements, consistent with motor concatenation. Direct and indirect pathways of basal ganglia were concomitantly active during sequence initiation, but behaved differently during sequence performance, revealing a more complex functional organization of these circuits than previously postulated. These results have important implications for understanding the functional organization of basal ganglia during the learning and execution of action sequences.


Conflict of interest statement

The authors declare no conflicts of interest.

Figures

Figure 1
Figure 1. Behavioral learning of rapid action sequences in mice
a, Return map of inter-press intervals (IPIs) showing the behavior of same mouse across the different schedules. Every two consecutive IPIs contribute to one dot in the map. b, An example of single-session inter-press interval (IPI) dynamics of the same mouse as in (a) under schedule of FR4/0.5s. Each dot indicates an IPI. The short (black dots), intermediate (pink dots) and long (red dots) IPIs represent two lever presses performed in a chunk, two lever presses spaced by magazine checking without reward (i.e. headentry, no licks followed), and two lever presses spaced by reward consummation (i.e. licks), respectively. Note that the first peak of the IPI distribution falls below 167ms (red dashed line) under the FR4/0.5s schedule. c, Behavioral microstructure of the same mouse performing under the FR4/0.5s schedule. Each dot indicates a lever press, with the red and black dots representing the first and final press within a sequence, and the blue dots intermediate presses. The vertical black dash lines imply the timing of reward. Black and red bars at the bottom indicate the timing of headentries and licks, respectively. Inset shows a rewarded lever press sequence. d, First, second and third IPI within a sequence changes across different schedules. e, Coefficient of variance for the first, second and third IPI across different training schedules. f, Sequence length during training under different schedules. g, Percentage of ultrafast sequences (FR4/0.5s) throughout training. Error bars denote SEM, same for all figures below.
Figure 2
Figure 2. Neuronal activity in the dorsal striatum during learning and performance of rapid action sequences
a, Peri-event histogram (PETH) of a MSN related to each lever press within each rewarded action sequence under FR4/1s schedule. Top panels: each black dot indicates a spike and the orange and red triangle markers indicate lever pressing and reward timing, respectively (same markers used for all PETHs unless otherwise stated). Bottom panels: Average firing activity of the cell in relation to lever pressing, time zero indicates the time of lever pressing. Left and right five panels are PETHs from the same cell; the right PETHs were zoomed in to show the fine temporal profile of the cell’s activity, and the four orange bars on top mark the average timing for each press within sequence, same for all PETHs. This MSN shows phasic increase in firing activity selectively before the first lever press of each action sequence. b, PETH of a MSN showing phasic firing rate increase selectively after the final lever press of each action sequence. c, MSN showing a decrease in firing rate throughout the whole action sequence. d, MSN showing sustained firing activity throughout the whole action sequence. e–g, Statistic results of percentage of MSNs showing start/stop (e), inhibited (f) or sustained (g) sequence-related activity in the striatum across different schedules. h, Lever press histogram (top panel) and PETH for an MSN showing sustained activity (bottom panel), both referenced to the 1st lever press. The lever press histogram (bottom panel, red line) was temporally shifted to calculate the correlation with PETH (see Methods). i, Percentage of sequence-related MSNs with sustained activity that showed significant correlation between the PETH and the average lever press rate.
Figure 3
Figure 3. Neuronal activity in the SNr and GPe during learning and performance of rapid action sequences
a, A SNr neuron shows phasic firing rate increase selectively before the first lever press of each action sequence. b, A SNr neuron shows inhibited firing activity throughout the whole action sequence. c, A GPe neuron displays sustained firing activity throughout the whole action sequence. d–f, Percentage of SNr (black) and GPe (red) neurons showing start/stop (d), inhibited (e) or sustained (f) sequence-related activity during the performance of action sequences under different schedules. h, The lever press histogram (top panel) and the sustained GPe neuron PETH (bottom panel) both aligned to the first lever press within action sequences. i, j, Percentage of neurons in SNr (i) and GPe (j) displaying sequence-related sustained activity with significant correlation between PETH and average lever press rate.
Figure 4
Figure 4. Action- vs. speed-specific sequence-related activity in the basal ganglia circuits
a–c, Percentage of action-specific (black bars) and speed-specific (red bars) start/stop, inhibited and sustained activity in striatum (a), SNr (b) and GPe (c), respectively.
Figure 5
Figure 5. Subcircuit-specific neuronal activity in the basal ganglia during learning and performance of rapid action sequences
a, A coronal section of dorsal striatum from a D1 Cre mouse with viral driven expression of ChR2-YFP; note axons targeting GPm and SNr. Scale bar 1mm. b, A coronal section of dorsal striatum from a D2 Cre mouse with viral driven expression of ChR2-YFP; note axons targeting GPe. Scale bar 1mm. c, Illustration of electrode array and cannula design allowing for adjustable fiber optic stimulation for cell identification. d, PETH of a MSN recorded in a D1-ChR2 mouse, showing sequence start related activity. e, Same neuron as (d) evident by identical waveform (black trace during action sequences vs. red trace during light stimulations, same for below) showed reliable, short-latency response to blue light stimulation. f, PETH of a MSN recorded in a D2-ChR2 mouse, showing sequence-related inhibited activity. g, Same neuron as (f) shows reliable, short-latency response to blue light stimulation at the end of session. Inset panel showing the neuronal response to light stimulation at fine time scale. h, i, PETH of a MSN recorded in a D1-ChR2 mouse, showing sequence-related sustained activity (h), and its response to light stimulation at the end of the session (i). j, Distribution of light to response latencies for D1- and D2-MSNs. k, l, Proportions of striatal D1-and D2-MSNs (k), and SNr and GPe neurons (l) displaying different types of sequence-related activity under FR4/0.5s. m, Percentage of striatal D1- or D2-MSNs displaying sequence start, stop, or boundary-related activity.

References

    1. Lashley KS. The problem of serial order in behavior. In: Jeffress LA, editor. Cerebral Mechanisms in Behavior. New York: John Wiley Press; 1951.
    1. Miller GA. The Magical Number Seven, Plus or Minus Two: Some Limits on Our Capacity for Processing Information. Psychological Review. 1956:81–97. - PubMed
    1. Gallistel CR. The organization of action: A new synthesis. Hillsdale, N. J.: Lawrence Erlbaum Associates, Inc.; 1980.
    1. Doupe AJ, Kuhl PK. Birdsong and human speech: common themes and mechanisms. Annu Rev Neurosci. 1999;22:567–631. - PubMed
    1. Sakai K, Kitaguchi K, Hikosaka O. Chunking during human visuomotor sequence learning. Exp Brain Res. 2003;152:229–242. - PubMed

Publication types

MeSH terms

Substances