. 2014 Mar;17(3):471-80.
doi: 10.1038/nn.3637. Epub 2014 Jan 26.

Rapid and reversible knockdown of endogenous proteins by peptide-directed lysosomal degradation

Affiliations

Rapid and reversible knockdown of endogenous proteins by peptide-directed lysosomal degradation

Xuelai Fan et al. Nat Neurosci. 2014 Mar.

Abstract

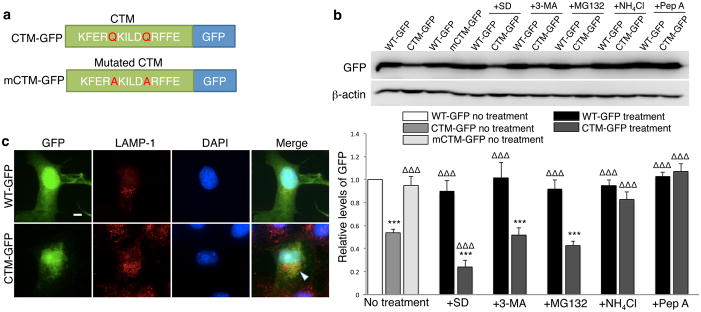
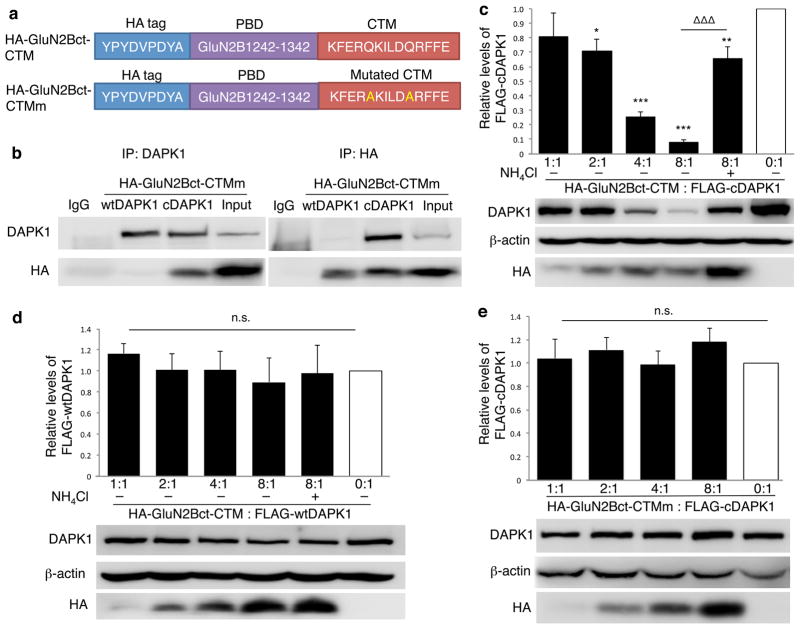
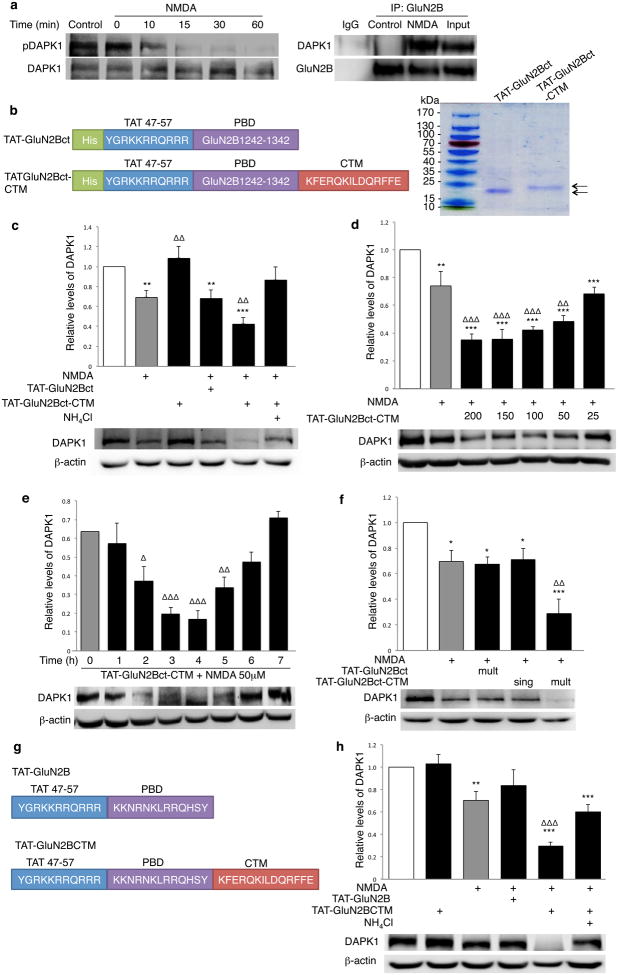
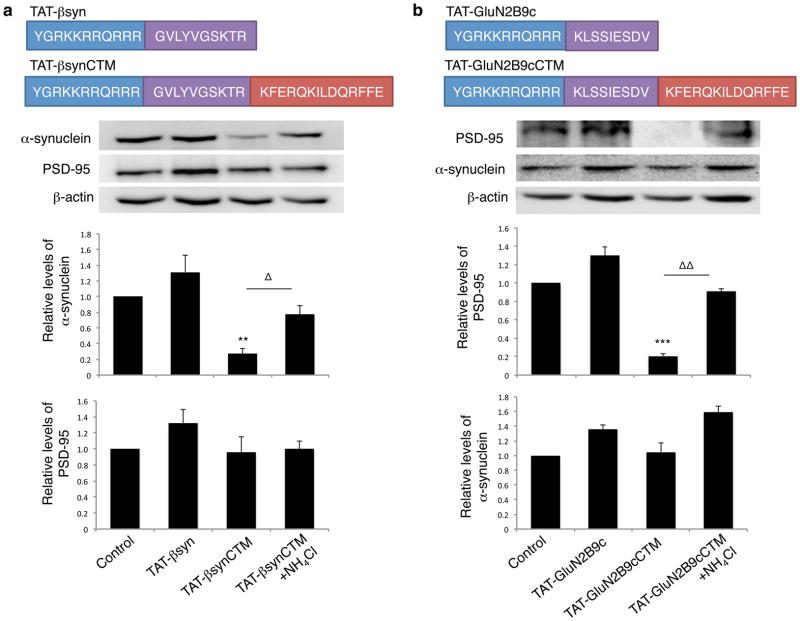
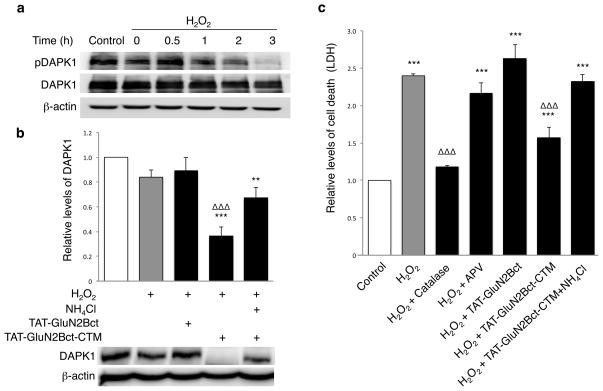
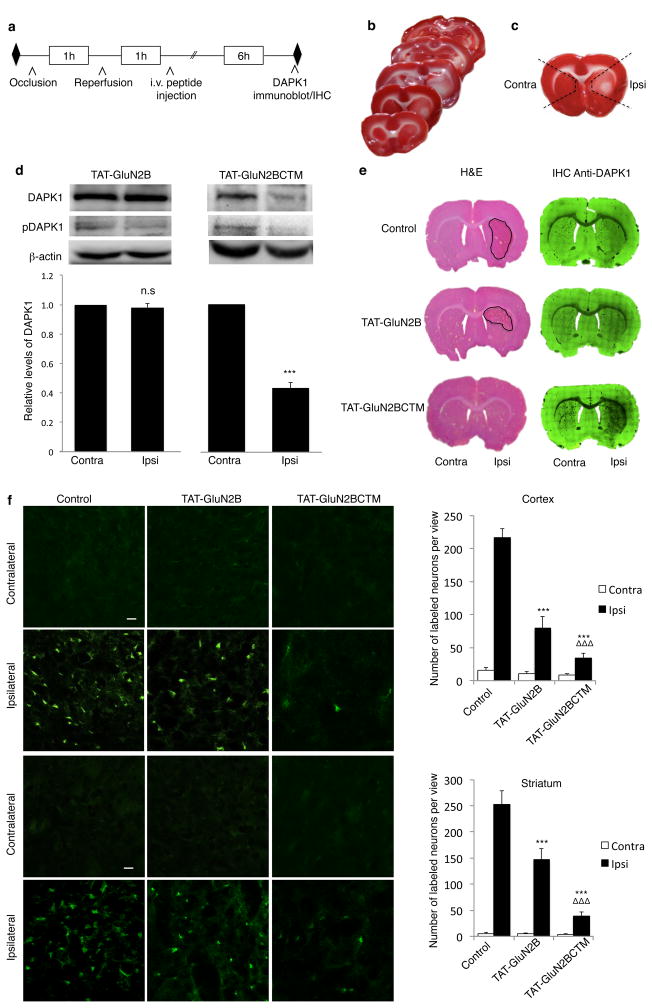
Rapid and reversible methods for altering the levels of endogenous proteins are critically important for studying biological systems and developing therapeutics. Here we describe a membrane-permeant targeting peptide-based method that rapidly and reversibly knocks down endogenous proteins through chaperone-mediated autophagy in vitro and in vivo. We demonstrate the specificity, efficacy and generalizability of the method by showing efficient knockdown of various proteins, including death associated protein kinase 1 (160 kDa), scaffolding protein PSD-95 (95 kDa) and α-synuclein (18 kDa), with their respective targeting peptides in a dose-, time- and lysosomal activity-dependent manner in rat neuronal cultures. Moreover, we show that, when given systemically, the peptide system efficiently knocked down the targeted protein in the brains of intact rats. Our study provides a robust and convenient research tool for manipulating endogenous protein levels and may also lead to the development of protein knockdown-based therapeutics for treating human diseases.


Figures

Figure 1
Figure 1. Chaperone-mediated autophagy (CMA) targeting motif (CTM)-directed protein degradation
(a) Linear representation of constructs CTM-GFP and mCTM-GFP. (b) Quantification of CTM-GFP and mCTM-GFP levels relative to WT-GFP in HEK cells 24hrs after individual transfections with WT-GFP, mCTM-GFP (n=6) or CTM-GFP. Cells transfected with WT-GFP or CTM-GFP were treated without (No treatment; n=13) or with serum deprivation (+SD; n=5; to enhance CMA activity) or macroautophagy inhibitor (+3-MA; 10mM; n=5), proteasome inhibitor (+MG132; 5μM; n=6), or lysosome inhibitor ammonium chloride (+NH4Cl; 20mM; n=6) or pepstatin A (+PepA; 10μM; n=5). Top panels are representative immunoblotting of cell lysates for GFP. Membranes re-probed for β-actin were used as a loading control. Bars in bottom panel represent relative protein levels, normalized to WT-GFP (arbitrarily set as 1; white bar). Sample size (n) represents the number of independent experiments from at least 4 separate cultures. One-way ANOVA with Fischer LSD was used for comparison, F(12,73)=20.939. ***p<0.001 versus WT-GFP (white bar); ΔΔΔ p<0.001 relative to non-treated CTM-GFP levels (grey bar). Bars represent mean values ± s.e.m. Full-length blots are presented in Supplementary Figure 9. (c) Representative confocal images of co-localization of GFP with the lysosome marker LAMP-1 in COS-7 cells transfected with either wild type GFP (WT-GFP; top; n=17) or CTM-tagged GFP (CTM-GFP; bottom; n=16). Quantification of co-localization demonstrated a significant increase in co-localization of GFP and LAMP-1 signals from 33.6±3.6% (WT-GFP) to 79.1±1.4% (CTM-GFP) by inclusion of the CTM. Mann-Whitney Rank Sum Test, T=408.000 p<0.001. ***p<0.001, scale bar: 20μm.
Figure 2
Figure 2. DAPK1 targeting peptide knocks down active DAPK1 in HEK cells
(a) Linear representation of DAPK1-targeting peptide HA-GluN2Bct-CTM and its non-functional control peptide HA-GluN2Bct-CTMm. (b) Reciprocal co-immunoprecipitation followed by immunoblotting revealed that GluN2Bct specifically interacted with cDAPK1, but not wtDAPK1. Flag-tagged wild type (inactive) DAPK1 (wtDAPK1) or constitutively active mutant of DAPK1 (cDAPK1) was co-expressed with either HA-GluN2Bct-CTM or HA-GluN2Bct-CTMm at various ratios in HEK cells, and co-immunoprecipitation and/or immunoblotting was performed 24hrs thereafter. Anti-HA was used to detect HA-GluN2Bct-CTM and HA-GluN2Bct-CTMm, while anti-FLAG was used to detect wtDAPK and cDAPK. (c) HA-GluN2Bct-CTM specifically and dose-dependently decreased the level of cDAPK1 (n=4 independent experiments from 4 separate cell cultures and transfections; p<0.001; F(5,18)=18.27), but not wtDAPK1 (d; n=3 independent experiments from 3 separate cell cultures and transfections; p=0.933; F(5,12)=0.249). HA-GluN2Bct-CTM mediated cDAPK1 knockdown was significantly reduced by NH4Cl (c; 20mM; n=4;ΔΔΔ p<0.001, compared to HA-GluN2Bct-CTM:cDAPK1=8:1 group) and by mutational inactivation of CTM (e; HA-GluN2Bct-CTMm; p=0.785; F(4,35)=0.432, 8 independent experiments from 8 separate cell cultures and transfections). Levels of cDAPK1 or wtDAPK1 co-transfected with pcDNA3.0 vector (0:1, white bar) represent the control values arbitrarily set as 1. Membranes re-probed for β-actin were used as a loading control. One-way ANOVA was used with Fischer LSD. *p<0.05 ** p<0.01 ***p<0.001, compared with the control. Bars represent relative mean values±s.e.m. Full-length blots are presented in Supplementary Figure 9.
Figure 3
Figure 3. DAPK1-targeting peptide specifically degrades activated endogenous DAPK1 in neuronal culture
(a) Left: NMDA (50μM; 30min) activated DAPK1, resulting in a time- dependent decrease in its phosphorylation levels (pDAPK1, n=4). Right: Co-immunoprecipitation with anti-GluN2B and sequential immunoblotting for DAPK1 and GluN2B showed an NMDA-induced association between DAPK1 and GluN2B (n=3). (b) Design and production of TAT-GluN2Bct-CTM and TAT-GluN2Bct peptides (Left) using E. coli expression system. Coomassie blue staining of SDS-PAGE assessed their purity (Right). (c) Bath application of TAT-GluN2Bct-CTM (200μM; n=9), but not TAT-GluN2Bct (200μM; n=6), knocked down activated DAPK1, which was prevented by NH4Cl (20mM; n=5; One-way ANOVA; P<0.001, F(5,36)=10.891), and dose- (d; n=4; p<0.001; F(6,21)=18.14) and time-dependent (e; p<0.001; F(8,44)=12.074). (f) A single pretreatment of TAT-GluN2Bct-CTM (sing; 200μM, 60 min prior to and during the 30min NMDA stimulation) produced a transient reduction of DAPK1, returning to baseline within 7hrs (n=4; p=0.888) and an additional dose of the peptide after NMDA washout resulted in a persistent decrease in DAPK1 up to 7hrs (mult; n=4; ΔΔp=0.002). One way ANOVA; p<0.001, F(4,15)=10.389. (g) Schematic illustration of synthetic peptides TAT-GluN2B and TAT-GluN2BCTM. (h) TAT-GluN2BCTM (25μM; n=5; p=0.001), but not control TAT-GluN2B (25μM; n=4; p=0.223) decreased native DAPK1, which was prevented by NH4Cl (20mM; n=5; p=0.302). One-way ANOVA, p<0.001, F(5,24)=13.591. Relative levels of DAPK1 were normalized to those in non-treated naïve and compared to naïve (white bar, *) or NMDA-treated group (grey bar, Δ). Membranes re-probed for β-actin were used as a loading control. Sample size represents number of individual experiments. Full-length blots are presented in Supplementary Figure 9.
Figure 4
Figure 4. Target peptide-mediated respective degradation of α-synuclein and PSD-95 in cultured neurons
(a) Top: Schematics of the synthetic cell-penetrating α-synuclein targeting peptide TAT-βsynCTM and its control TAT-βsyn. Middle: Immunoblots demonstrate that TAT-βsynCTM (25μM; n=5), but not the CTM-lacking control peptide TAT-βsyn (25μM; n=5), specifically decreased the targeted endogenous α-synuclein (One way-ANOVA Tukey post-hoc, p<0.001, F(3,16)=12.435), without affecting the level of unrelated control proteins PSD-95 at 4 hours (bottom), and this reduction was prevented in the presence of lysosomal inhibitor NH4Cl (20mM; n=5). Sample size represents individual experiments from at least 3 separate primary cultures. (b) Top: Schematics of PSD-95 targeting peptide TAT-GluN2B9cCTM and control TAT-GluN2B9c. Middle: TAT-GluN2B9cCTM (25μM; n=4), but not Tat-GluN2B9c (25μM; n=4), effectively degraded endogenous PSD-95 (One-way ANOVA Tukey post-hoc, p<0.001, F(3,12)=18.154) without perturbing untargeted protein α-synuclein (Bottom). NH4Cl rescued PSD-95 degradation. Sample size represents individual experiments from at least 2 separate primary cultures. Membrane re-probing for β-actin was used as additional specificity and loading controls. * p<0.05, **,ΔΔ p<0.01 and ***p<0.001; bars represent relative mean values±s.e.m. normalized to the naïve non-treated control (arbitrarily set as 1). Full length blots were presented in Supplementary Figure 9.
Figure 5
Figure 5. TAT-GluN2Bct-CTM knocks down H2O2-activated DAPK1, protecting neurons against H2O2-induced neurotoxicity in neuronal cultures
(a) Immunoblotting for phosphorylated DAPK1 (pDAPK1) revealed a time-dependent activation (dephosphorylation) of DAPK1 by H2O2 treatment (300μM; 30min; n=4). (b) Bath application of 100μM TAT-GluN2Bct-CTM (36.54±7.1% of control; n=8; p=0.001), but not TAT-GluN2Bct (89.13±10.78%; n=7; p=0.311), 60min prior to and during H2O2 treatment (300μM; 30min) knocked down DAPK1 at 2hrs post-washout, which was rescued by NH4Cl (20mM; n=8; p=0.003 to control*; p=0.106 to H2O2-treatedΔ). One-way ANOVA, F(4,34)=11.628, p<0.001. Bars represent DAPK1 levels relative to naïve group. β-actin was used as a loading control. (c) LDH assay revealed that H2O2 treatment (300μM; 30min) resulted in a significant increase in neuronal death 12hrs after treatment (n=8; 2.50±0.12; p<0.001 to control), which was rescued by breaking down H2O2 with catalase (100U; n=4; 1.17±0.02; p=0.001 to H2O2 group). H2O2-induced neurotoxicity was significantly reduced by TAT-GluN2Bct-CTM (50μM; applied 60min prior to and maintained throughout the experiments; n=9; 1.56±0.08; p=0.001 to H2O2 group), but not by TAT-GluN2Bct (50μM; n=9; 2.63±0.10; p=0.105 to H2O2 group) or the NMDAR antagonist APV (1μM; n=4; 2.16±0.14; p=0.169 to H2O2 group). NH4Cl abolished the neuroprotective effect of TAT-GluN2Bct-CTM (n=4; 2.39±0.27; p=0.538 compared to H2O2 group). One-way ANOVA, p<0.001, F(6,41)=26.842. * p<0.05, **,ΔΔ p<0.01 and ***, ΔΔΔp<0.001; bars represent relative mean values±s.e.m. normalized to the naïve control (white bar, arbitrarily set as 1). n represents individual experiments from at least 3 separate primary cultures. Full-length blots are presented in Supplementary Figure 9.
Figure 6
Figure 6. TAT-GluN2BCTM specifically knocks down DAPK1 in ischemic brain areas and reduces neuronal damage in the MCAo model of focal ischemia in rats
(a) Timeline of tissue collection for analysis of DAPK1 degradation in rats. (b) 2,3,5-triphenyltetrazolium chloride (TTC) staining of a series of transverse brain sections showed reliable damage in the ipsilateral side following unilateral MCAo. (c) Black-dashed lines represent brain areas removed for immunoblotting. (d) Immunoblots demonstrate specific DAPK1 knockdown in the infract (Ipsi), but not contralateral (Contra) side following application of TAT-GluN2BCTM (10mg/kg, i.v.; n=3; t(4)=14.459, p<0.001), but not TAT-GluN2B (10mg/kg, i.v.; n=3; t(4)=0.739, p=0.501). β-actin was used as a loading control, two-tailed student’s t-test ***p<0.001 (e) Images of Hematoxylin & Eosin (left) and immunohistochemical DAPK1 staining (right) of adjacent brain sections show that compared with saline (top) and TAT-GluN2B treated (middle) controls, TAT-GluN2BCTM treatment (bottom) selectively reduced infarct area (left) and DAPK1 levels (right) ipsilaterally. (f) Left, images of brain sections stained with Fluorojade B in rats injected with saline (n=6), TAT-GluN2B (n=5) or TAT-GluN2BCTM (n=5) after treatment as shown in a, scale bar 20μm. Right, quantification of cellular damage by counting the number of Fluorojade B-positive cells in each image at 10X magnification. TAT-GluN2BCTM (10mg/kg) displayed more prominent neuroprotection in the cortex (top p<0.001) and striatum (bottom p<0.001) as compared to TAT-GluN2B (10mg/kg). Cortex: H(2)=41.235; p<0.001; striatum: H(2)=38.808; p<0.001. Kruskal-Wallis ANOVA on ranks with Dunn’s post-hoc, bars represent relative mean values±s.e.m, ***,ΔΔΔp<0.001. n represents tissue from 3 animals collected from at least 2 litters. Full-length blots are presented in Supplementary Figure 9.

Comment in

  • Knocking down Goliath.
    Pastrana E. Pastrana E. Nat Methods. 2014 Mar;11(3):232. doi: 10.1038/nmeth.2875. Nat Methods. 2014. PMID: 24724170 No abstract available.

References

    1. Houdebine LM. Transgenic animal models in biomedical research. Methods Mol Biol. 2007;360:163–202. - PubMed
    1. Yamamoto A, Hen R, Dauer WT. The Ons and Offs of Inducible Transgenic Technology: A Review. Neurobiology of Disease. 2001;8:923–932. - PubMed
    1. Kole R, Krainer AR, Altman S. RNA therapeutics: beyond RNA interference and antisense oligonucleotides. 2012:1–16. doi: 10.1038/nrd3625. - DOI - PMC - PubMed
    1. Castanotto D, Rossi JJ. The promises and pitfalls of RNA-interference-based therapeutics. Nature. 2009;457:426–433. - PMC - PubMed
    1. Banaszynski LA, Wandless TJ. Conditional Control of Protein Function. Chemistry & Biology. 2006;13:11–21. - PubMed

Publication types