Comparative Study
. 2014 Mar;17(3):455-62.
doi: 10.1038/nn.3635. Epub 2014 Jan 26.

Resolving human object recognition in space and time

Affiliations
Comparative Study

Resolving human object recognition in space and time

Radoslaw Martin Cichy et al. Nat Neurosci. 2014 Mar.

Abstract

A comprehensive picture of object processing in the human brain requires combining both spatial and temporal information about brain activity. Here we acquired human magnetoencephalography (MEG) and functional magnetic resonance imaging (fMRI) responses to 92 object images. Multivariate pattern classification applied to MEG revealed the time course of object processing: whereas individual images were discriminated by visual representations early, ordinate and superordinate category levels emerged relatively late. Using representational similarity analysis, we combined human fMRI and MEG to show content-specific correspondence between early MEG responses and primary visual cortex (V1), and later MEG responses and inferior temporal (IT) cortex. We identified transient and persistent neural activities during object processing with sources in V1 and IT. Finally, we correlated human MEG signals to single-unit responses in monkey IT. Together, our findings provide an integrated space- and time-resolved view of human object categorization during the first few hundred milliseconds of vision.


Figures

Figure 1
Figure 1. Decoding of images from MEG signals
(a) Image set of. 92 images, of different categories of objects. (b) Multivariate analysis of MEG data. (c) Examples of 92 × 92 MEG decoding matrices (averaged over participants, n=16).. (d) Time course of grand total decoding. was significant at 48ms (45–51ms), with a peak at 102ms (98–107ms; horizontal error bar above peak shows 95% confidence interval). (e) Time course of object decoding within subdivisions. The left panel illustrates the separately averaged sections of the MEG decoding matrix (color-coded), the right panel the corresponding decoding time courses. Peak-latencies and onsets of significance are listed in Supplementary Table 1b. Stars indicate significant time points (n=16, cluster-defining threshold p<0.001, corrected significance level p<0.05). The gray vertical line indicates onset of image presentation.
Figure 2
Figure 2
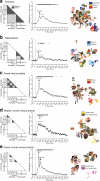
Time course of decoding category membership of individual objects. We decoded object category membership for, (a) animacy, (b) naturalness, (c) faces versus bodies, (d) human bodies versus non-human bodies and (e) human versus non-human faces. The difference of within-subdivision (dark gray, left panel) minus between-subdivision (light gray, left panel) Peaks in decoding accuracy differences indicate time points at which the ratio of dissimilarity within a subdivision to dissimilarity across subdivision is smallest. n=16, stars, vertical gray line, and error bars same as in Figure 1. Statistical details are in Supplementary Table 1c., The right panel illustrates the structure in the MEG decoding matrix at peak latency revealed by the first two dimensions of the multidimensional scaling solution (MDS, criterion: metric stress, 0.24 for (a,b,c,e), 0.27 for (d)). Abbreviations: dec. acc. = decoding accuracy.
Figure 3
Figure 3
Dynamics of visual representations across time. (a) MEG brain responses were extracted for time points tx and ty after stimulus onset. SVM wasis trained to distinguish between images by visual representations at time point tx, and tested on brain responses to the same images at a different time point ty. We conducted all object classifications and averaged the overall decoding accuracy. Last, the averaged decoding accuracy was stored in the element (tx,ty) of a time-time MEG decoding matrix. The process was repeated for all pairs of time points. (b,c) Time-time decoding matrix averaged across participants. The gray lines indicate onset of image presentation. The white dotted rectangle indicates classifier generalization for the time-point combination ~100ms and 200-1,000ms, the dotted ellipse indicates classifier generalization by the broadened diagonal. (d) Significance was assessed by sign-permutation tests (n=16, cluster-defining threshold p<0.0001, corrected significance level p<0.05). Dark red indicates elements within the significant cluster.
Figure 4
Figure 4
Relating MEG and fMRI signals in V1 and IT. (a) We select voxels in two regions-of-interest (ROI): V1 and . IT, For each condition, we extracted voxel activation values, yielding 92 pattern vectors., we calculated pairwise Pearson's correlation (R) for all combinations of experimental conditions (i,j). The dissimilarity measure 1–R was assigned to a 92 × 92 fMRI dissimilarity matrix indexed by the experimental conditions (i,j). This analysis was conducted independently for each ROI. (b)For each time point t, we correlated (Spearman's rank-order correlation) the MEG decoding matrix to the fMRI dissimilarity matrices of V1 and IT. (c)MEG signals correlated with V1 earlier than with IT. Blue and red stars indicate significant time points for V1 and IT. (d) Difference curve between the two curves as in (c). MEG correlated early more with V1 than with IT, and later more with IT than with V1. Green and red stars in the plots indicate significant time points for positive and negative clusters respectively. For details see Supplementary Table 1d. n=16, Gray line and statistical procedure same as in Fig. 1.
Figure 5
Figure 5
Relating MEG and fMRI signals across time. (a) 92 × 92 decoding matrices were extracted for each combination of time points (tx, ty), and were correlated (Spearman's rank-order correlation) with the fMRI dissimilarity matrices for V1 and IT. The resulting correlation was assigned to a time-time MEG-fMRI correlation matrix at tx,ty. (b,c) Top panel displays the time-time MEG and fMRI correlation matrix for V1 and IT. Bottom panel shows significant cluster results (n=16, cluster-defining threshold p<0.0001, corrected significance level p<0.05). Neural activity for the time point combinations of ~100ms and ~200–1,000ms (marked by white dotted rectangle) correlated with V1. (c) Neural activity between ~250ms and ~500ms (marked by the striped white ellipse) correlated with IT. (d) Difference between V1 and IT. Gray lines as in Figure 1.
Figure 6
Figure 6
Relating human MEG and electrophysiological signals in monkey IT. (a) The MEG decoding matrix at time t was compared (Spearman's rank-order correlation R) against the monkey dissimilarity matrix in IT,. The lower form of the monkey IT matrix is shown as percentiles of 1–R. - (b) Representational dissimilarities inhuman MEG and monkey IT correlated significantly starting at 54ms (52–64ms), with a peak latency of 141ms (132–292ms). c) MDS at peak-latency. d) Results at the fine-grained level of the image set. Representational dissimilarities were similar across species and methods even for the finest categorical subdivision of the image set. n=16, stars and gray line same as in Figure 1.

Comment in

References

    1. Grill-Spector K, Malach R. The Human Visual Cortex. Annu. Rev. Neurosci. 2004;27:649–677. - PubMed
    1. Hung CP, Kreiman G, Poggio T, DiCarlo JJ. Fast Readout of Object Identity from Macaque Inferior Temporal Cortex. Science. 2005;310:863–866. - PubMed
    1. Kriegeskorte N, et al. Matching Categorical Object Representations in Inferior Temporal Cortex of Man and Monkey. Neuron. 2008;60:1126–1141. - PMC - PubMed
    1. Kourtzi Z, Connor CE. Neural Representations for Object Perception: Structure, Category, and Adaptive Coding. Annu. Rev. Neurosci. 2011;34:45–67. - PubMed
    1. DiCarlo JJ, Zoccolan D, Rust NC. How Does the Brain Solve Visual Object Recognition? Neuron. 2012;73:415–434. - PMC - PubMed

Publication types

LinkOut - more resources