

DNA hypermethylation in prostate cancer is a consequence of aberrant epithelial differentiation and hyperproliferation
- PMID: 24464224
- PMCID: PMC3978305
- DOI: 10.1038/cdd.2013.202
DNA hypermethylation in prostate cancer is a consequence of aberrant epithelial differentiation and hyperproliferation
Abstract
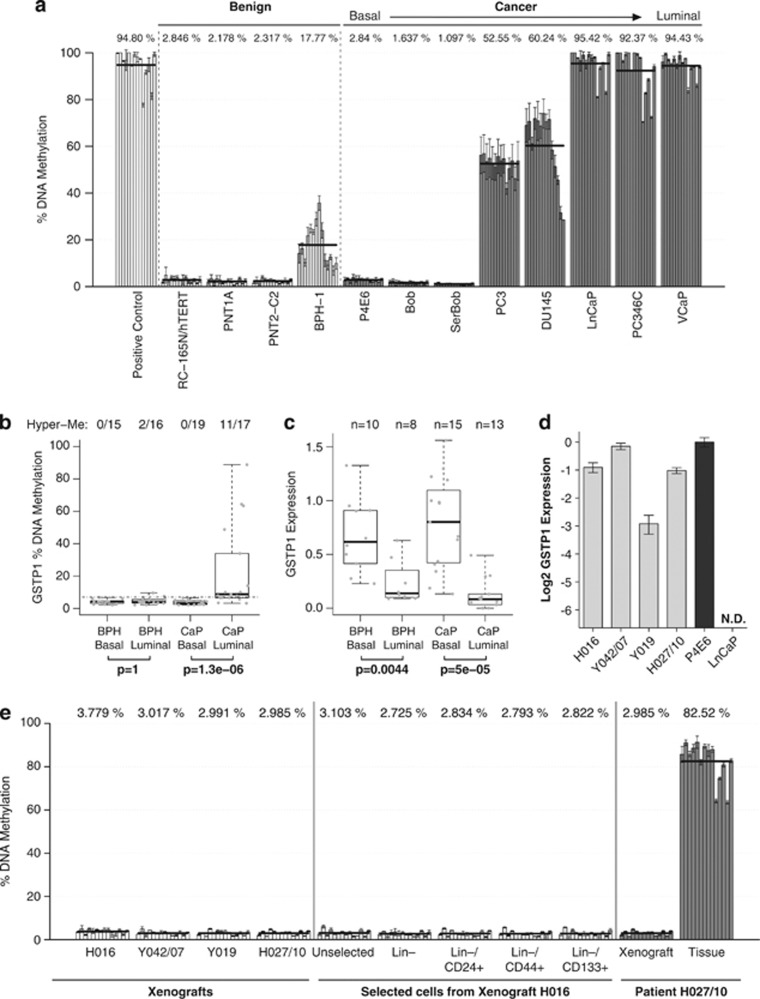
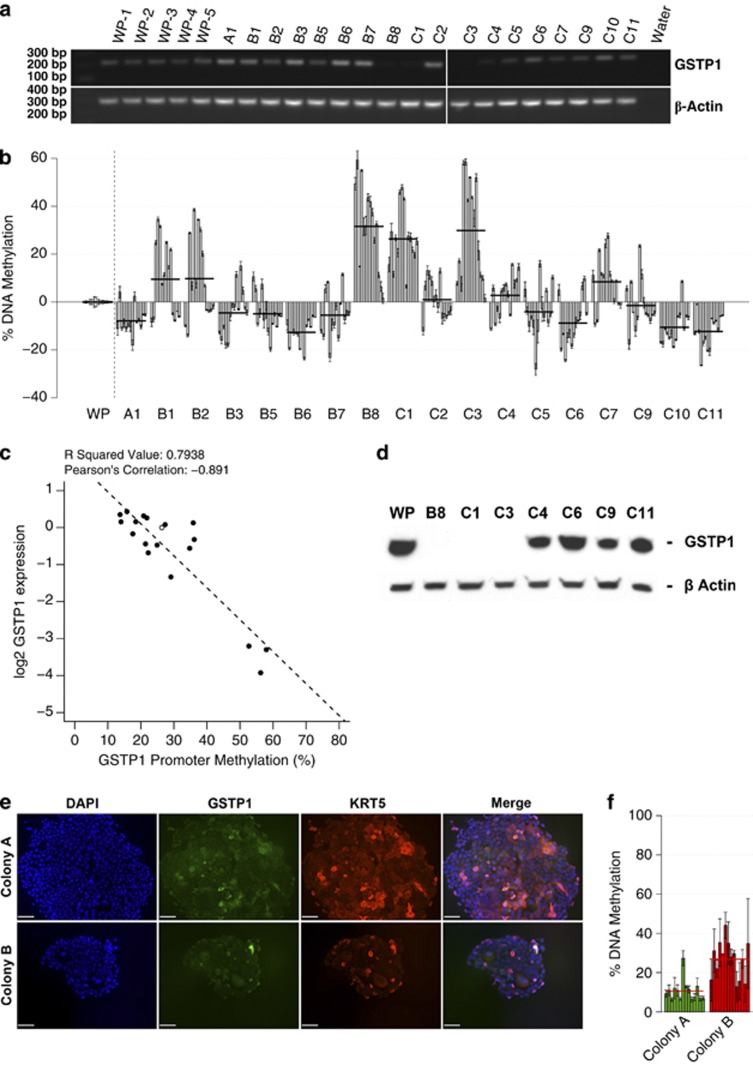
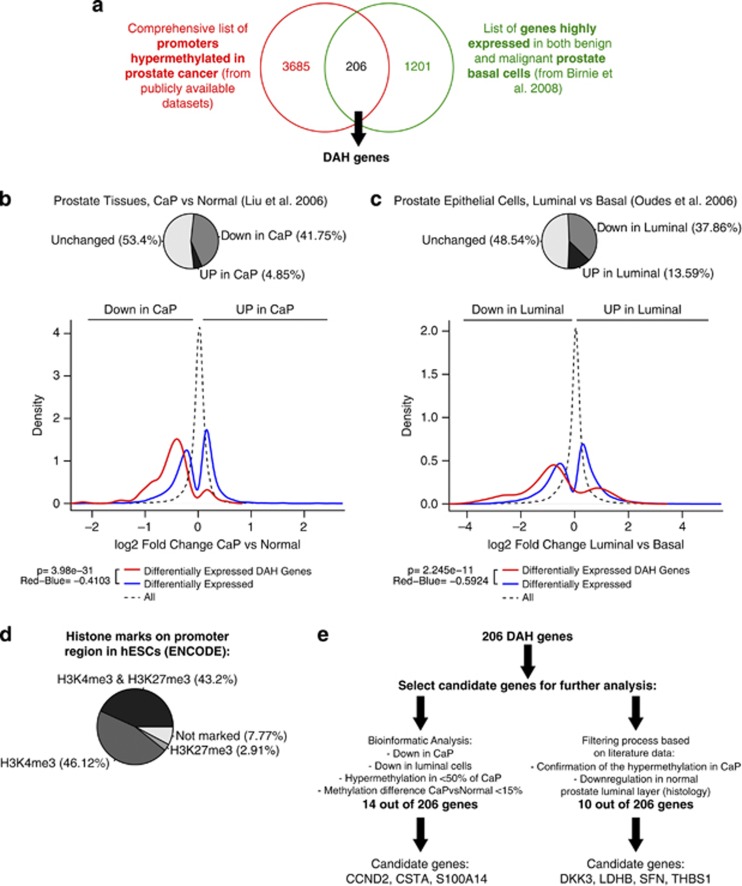
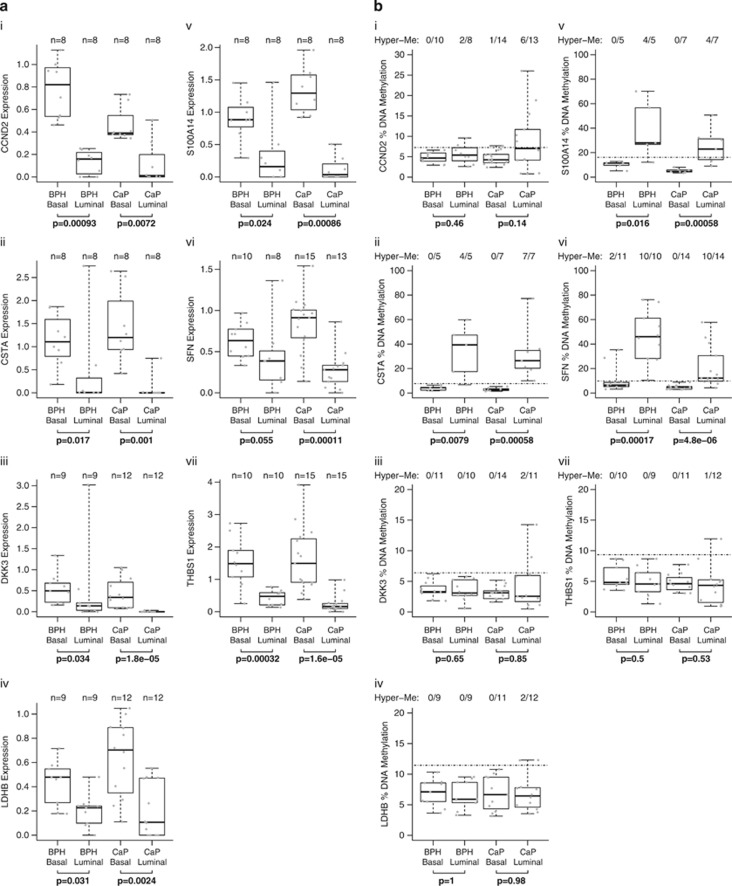
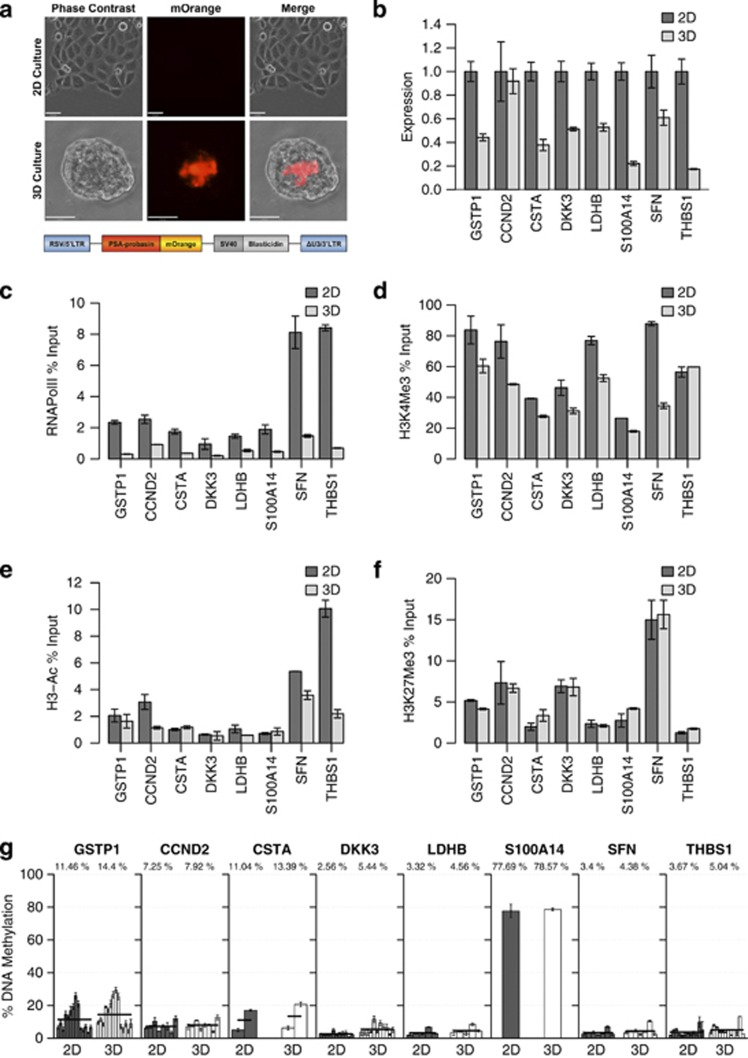
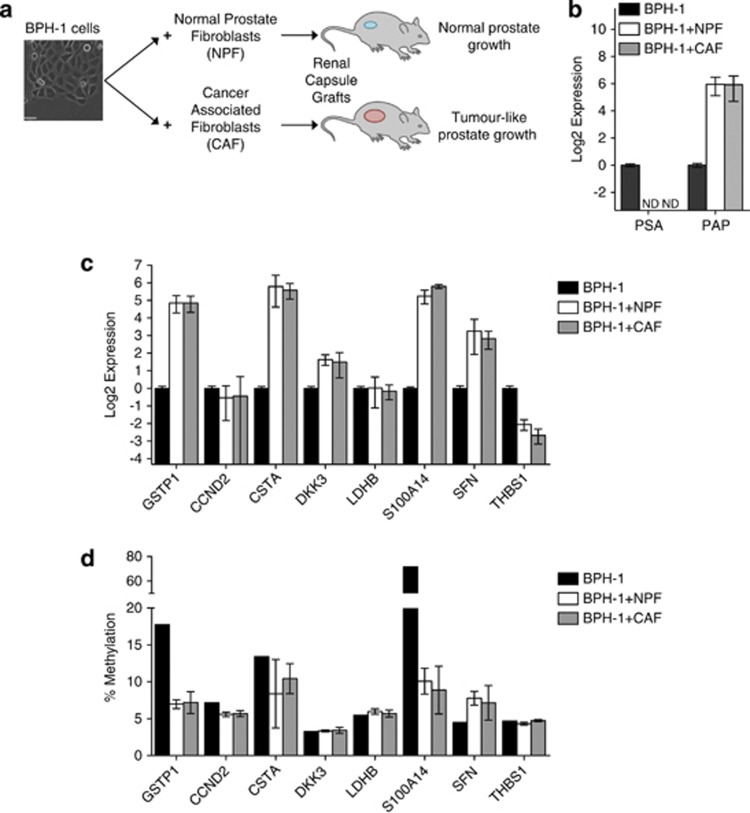
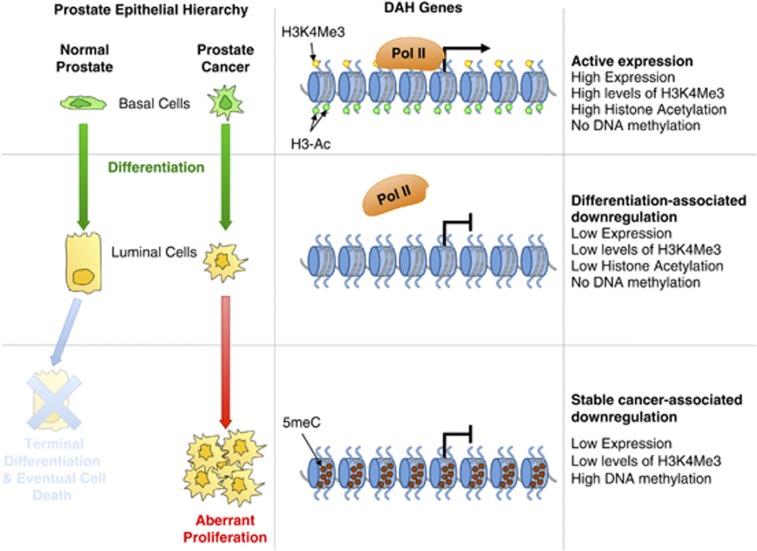
Prostate cancer (CaP) is mostly composed of luminal-like differentiated cells, but contains a small subpopulation of basal cells (including stem-like cells), which can proliferate and differentiate into luminal-like cells. In cancers, CpG island hypermethylation has been associated with gene downregulation, but the causal relationship between the two phenomena is still debated. Here we clarify the origin and function of CpG island hypermethylation in CaP, in the context of a cancer cell hierarchy and epithelial differentiation, by analysis of separated basal and luminal cells from cancers. For a set of genes (including GSTP1) that are hypermethylated in CaP, gene downregulation is the result of cell differentiation and is not cancer specific. Hypermethylation is however seen in more differentiated cancer cells and is promoted by hyperproliferation. These genes are maintained as actively expressed and methylation-free in undifferentiated CaP cells, and their hypermethylation is not essential for either tumour development or expansion. We present evidence for the causes and the dynamics of CpG island hypermethylation in CaP, showing that, for a specific set of genes, promoter methylation is downstream of gene downregulation and is not a driver of gene repression, while gene repression is a result of tissue-specific differentiation.
Figures
Similar articles
-
Regulation of the stem cell marker CD133 is independent of promoter hypermethylation in human epithelial differentiation and cancer.Mol Cancer. 2011 Jul 29;10:94. doi: 10.1186/1476-4598-10-94. Mol Cancer. 2011. PMID: 21801380 Free PMC article.
-
Hypermethylation of CpG islands in primary and metastatic human prostate cancer.Cancer Res. 2004 Mar 15;64(6):1975-86. doi: 10.1158/0008-5472.can-03-3972. Cancer Res. 2004. PMID: 15026333
-
Reversal of GSTP1 CpG island hypermethylation and reactivation of pi-class glutathione S-transferase (GSTP1) expression in human prostate cancer cells by treatment with procainamide.Cancer Res. 2001 Dec 15;61(24):8611-6. Cancer Res. 2001. PMID: 11751372
-
GSTP1 CpG island hypermethylation as a molecular biomarker for prostate cancer.J Cell Biochem. 2004 Feb 15;91(3):540-52. doi: 10.1002/jcb.10740. J Cell Biochem. 2004. PMID: 14755684 Review.
-
Molecular biomarker in prostate cancer: the role of CpG island hypermethylation.Eur Urol. 2004 Dec;46(6):698-708. doi: 10.1016/j.eururo.2004.07.022. Eur Urol. 2004. PMID: 15548435 Review.
Cited by
-
DNA hypermethylation driven by DNMT1 and DNMT3A favors tumor immune escape contributing to the aggressiveness of adrenocortical carcinoma.Clin Epigenetics. 2023 Aug 2;15(1):121. doi: 10.1186/s13148-023-01534-5. Clin Epigenetics. 2023. PMID: 37528470 Free PMC article.
-
Tumor necrosis factor-α decreases EC-SOD expression through DNA methylation.J Clin Biochem Nutr. 2017 May;60(3):169-175. doi: 10.3164/jcbn.16-111. Epub 2017 Apr 7. J Clin Biochem Nutr. 2017. PMID: 28584398 Free PMC article.
-
Phenotype-independent DNA methylation changes in prostate cancer.Br J Cancer. 2018 Oct;119(9):1133-1143. doi: 10.1038/s41416-018-0236-1. Epub 2018 Oct 15. Br J Cancer. 2018. PMID: 30318509 Free PMC article.
-
Methylation of PITX2, HOXD3, RASSF1 and TDRD1 predicts biochemical recurrence in high-risk prostate cancer.J Cancer Res Clin Oncol. 2014 Nov;140(11):1849-61. doi: 10.1007/s00432-014-1738-8. Epub 2014 Jun 18. J Cancer Res Clin Oncol. 2014. PMID: 24938434 Free PMC article.
-
Integrated analysis reveals common DNA methylation patterns of alcohol-associated cancers: A pan-cancer analysis.Front Genet. 2023 Feb 13;14:1032683. doi: 10.3389/fgene.2023.1032683. eCollection 2023. Front Genet. 2023. PMID: 36861126 Free PMC article.
References
-
- Feinberg AP, Ohlsson R, Henikoff S. The epigenetic progenitor origin of human cancer. Nat Rev Genet. 2006;7:21–33. - PubMed
-
- Miller SJ, Lavker RM, Sun T-T. Interpreting epithelial cancer biology in the context of stem cells: tumor properties and therapeutic implications. Biochim Biophys Acta. 2005;1756:25–52. - PubMed
-
- Clevers H. The cancer stem cell: premises, promises and challenges. Nat Med. 2011;17:313–319. - PubMed
-
- Collins AT, Berry PA, Hyde C, Stower MJ, Maitland NJ. Prospective identification of tumorigenic prostate cancer stem cells. Cancer Res. 2005;65:10946–10951. - PubMed
Publication types
MeSH terms
LinkOut - more resources
Full Text Sources
Other Literature Sources
Medical
Research Materials
Miscellaneous
