. 2014 May;21(5):748-60.
doi: 10.1038/cdd.2013.203. Epub 2014 Jan 24.

A functional genomics screen identifies PCAF and ADA3 as regulators of human granzyme B-mediated apoptosis and Bid cleavage

Affiliations

A functional genomics screen identifies PCAF and ADA3 as regulators of human granzyme B-mediated apoptosis and Bid cleavage

D Brasacchio et al. Cell Death Differ. 2014 May.

Abstract

The human lymphocyte toxins granzyme B (hGrzB) and perforin cooperatively induce apoptosis of virus-infected or transformed cells: perforin pores enable entry of the serine protease hGrzB into the cytosol, where it processes Bid to selectively activate the intrinsic apoptosis pathway. Truncated Bid (tBid) induces Bax/Bak-dependent mitochondrial outer membrane permeability and the release of cytochrome c and Smac/Diablo. To identify cellular proteins that regulate perforin/hGrzB-mediated Bid cleavage and subsequent apoptosis, we performed a gene-knockdown (KD) screen using a lentiviral pool of short hairpin RNAs embedded within a miR30 backbone (shRNAmiR). We transduced HeLa cells with a lentiviral pool expressing shRNAmiRs that target 1213 genes known to be involved in cell death signaling and selected cells with acquired resistance to perforin/hGrzB-mediated apoptosis. Twenty-two shRNAmiRs were identified in the positive-selection screen including two, PCAF and ADA3, whose gene products are known to reside in the same epigenetic regulatory complexes. Small interfering (si)RNA-mediated gene-KD of PCAF or ADA3 also conferred resistance to perforin/hGrzB-mediated apoptosis providing independent validation of the screen results. Mechanistically, PCAF and ADA3 exerted their pro-apoptotic effect upstream of mitochondrial membrane permeabilization, as indicated by reduced cytochrome c release in PCAF-KD cells exposed to perforin/hGrzB. While overall levels of Bid were unaltered, perforin/hGrzB-mediated cleavage of Bid was reduced in PCAF-KD or ADA3-KD cells. We discovered that PCAF-KD or ADA3-KD resulted in reduced expression of PACS2, a protein implicated in Bid trafficking to mitochondria and importantly, targeted PACS2-KD phenocopied the effect of PCAF-KD or ADA3-KD. We conclude that PCAF and ADA3 regulate Bid processing via PACS2, to modulate the mitochondrial cell death pathway in response to hGrzB.


Figures
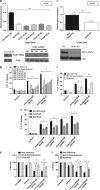
Figure 1
Figure 1
Reduction in PCAF or ADA3 expression by shRNA leads to resistance to perforin/hGrzB-mediated cell death. (a) HeLa were transduced with shRNA targeting non-silencing (NS), PCAF or ADA3. Five PCAF shRNA (PCAF, PCAF-88, PCAF-89, PCAF-90, PCAF-91) were used which target different areas of the PCAF gene where PCAF refers to the shRNA identified from the original screen (Supplementary Figure 2). Determination of gene and protein knockdown of i. PCAF and ii. ADA3 in HeLa. For gene detection, RNA was extracted and relative mRNA expression of PCAF or ADA3 in HeLa was measured by qRT–PCR. Protein detection was observed by subjecting whole-cell lysates to immunoblot for PCAF or ADA3 with Actin serving as a protein loading control. (b) HeLa with shRNA-mediated depletion of PCAF or ADA3 were suppressed from perforin/hGrzB-mediated death after 4 h. HeLa with KD of PCAF, ADA3 or non-silencing compared with stable Bcl-2-overexpressing cells, were treated with sublytic perforin in the absence or presence of hGrzB at 20 nM or 60 nM and a 4 h 51Cr release assay performed. 51Cr release for i. PCAF-KD or ii. ADA3-KD cells compared with non-silencing or Bcl-2-overexpression HeLa and iii. Perforin/hGrzB titration of PCAF-KD or ADA3-KD cells compared with non-silencing HeLa. (c) HeLa with shRNA-mediated depletion of PCAF or ADA3 were suppressed from perforin/hGrzB-mediated death after 24 h. HeLa with KD of PCAF, ADA3 or non-silencing compared with stable Bcl-2-overexpressing cells, were treated with sublytic perforin in the absence or presence of hGrzB at 20 nM and 60 nM and an AB viability assay performed at 24 h. AB exclusion for i. PCAF-KD or ii. ADA3-KD cells compared with the non-silencing or Bcl-2-overexpression HeLa. Error bars represent S.E.M., n=3. Statistical analysis performed: one-way ANOVA versus non-silencing and a Bonferroni test, *P<0.05, **P<0.01 and ***P<0.001. Immunoblots are a representative of three independent experiments
Figure 2
Figure 2
Combined PCAF and ADA3 knockdown maintains resistance to perforin/hGrzB-mediated cell death. (a) HeLa transduced with both PCAF and ADA3 shRNA (PCAF- and ADA3-KD) had reduced expression of both PCAF and ADA3. RNA was extracted from non-silencing, PCAF-KD, ADA3-KD and PCAF- and ADA3-KD HeLa and relative mRNA expression was detected by qRT-PCR. i. PCAF gene expression for non-silencing, PCAF-KD, PCAF- and ADA3-KD. ii. ADA3 gene expression for non-silencing, ADA3-KD, PCAF- and ADA3-KD. (b) HeLa with PCAF- and ADA3-KD was suppressed from perforin/hGrzB-mediated cell death similar to PCAF-KD or ADA3-KD cells. HeLa non-silencing, PCAF-KD, ADA3-KD or PCAF- and ADA3-KD were treated with sublytic perforin in the absence or presence of hGrzB at 20 nM or 60 nM and a 4 h 51Cr release assay completed. Error bars represent S.E.M., n=3. Statistical analysis performed: one way ANOVA versus non-silencing and a Bonferroni test, **P<0.01 and ***P<0.001
Figure 3
Figure 3
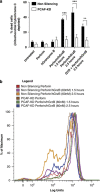
PCAF depletion leads to suppression of perforin/hGrzB-mediated mitochondrial cytochrome c release. Cytochrome c release of HeLa PCAF-KD cells is reduced. HeLa non-silencing or PCAF-KD cells were treated with perforin in the absence or presence of hGrzB (60 nM) or QVD (10 uM) for the indicated times then analyzed for cytochrome c staining by FACS. (a) Bar chart representing cytochrome c stained cells for HeLa PCAF-KD compared with non-silencing. (b) The panels show FACS overlays of non silencing or PCAF-KD cells. The X axis depicts log units and represents the level of cytochrome c-stained cells. A reduction in units indicates a loss of cytochrome c from the mitochondria. Error bars represent S.E.M., n=3. Statistical analysis performed: one way ANOVA versus non silencing and a Bonferroni test, **P<0.01 and ***P<0.001
Figure 4
Figure 4
PCAF-KD or ADA3-KD HeLa are sensitive to TRAIL and UV light treatment. (a) PCAF-KD or ADA3-KD HeLa are sensitive to TRAIL treatment similar to non-silencing cells while Bcl-2-overexpression cells remain resistant. Non-silencing, PCAF-KD, ADA3-KD or Bcl-2-overexpression cells were treated with TRAIL (160 ng/ml), and cultured for 16 h and assessed for cell viability by i. 7-AAD staining and FACS, a bar chart shows the % 7-AAD positive cells or ii. AB exclusion assay. (b) PCAF-KD or ADA3-KD HeLa have caspase processing following TRAIL treatment similar to non-silencing cells. Non-silencing, PCAF-KD, ADA3-KD or Bcl-2-overexpression cells were treated with TRAIL (160 ng/ml), cultured for 16 h and assessed for caspase processing. Whole-cell lysates were subjected to immunoblot and probed for i. caspase-8 (CSP8); full length (FL); activated (p43/p41); or cleaved (p18) and ii. Caspase-3 (CSP3); full length (FL), processed (p20) or cleaved (p17). A lighter FL CSP3 (upper panel) is also presented. Total protein was evaluated by probing for Actin. (c) PCAF-KD or ADA3-KD HeLa are sensitive to UV light similar to non-silencing cells while Bcl-2-overexpression cells remain resistant. Non-silencing, PCAF-KD, ADA3-KD or Bcl-2-overexpressing cells were subjected to UV light treatment for 10, 20 or 30 joules/cm2 (J/ cm2) cultured for 16 h and assessed for cell viability and caspase processing. i. 7-AAD staining and FACS, a bar chart shows the % 7-AAD positive cells. ii. Caspase-3 processing assessment by subjecting whole-cell lysates to immunoblot for caspase-3 (CSP3) full length (FL) and processed (p20). The upper panel shows a lightly exposed FL CSP3 blot. Total protein was evaluated by probing for Actin. Error bars represent S.E.M., n=3. Immunoblots are a representative of 3 independent experiments
Figure 5
Figure 5
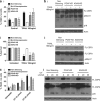
PCAF-KD or ADA3-KD cells have reduced perforin/hGrz-mediated Bid processing. (a) PCAF-KD suppresses perforin/hGrzB-mediated Bid processing. Non-silencing or PCAF-KD HeLa were treated for 10, 30 or 60 min with sublytic perforin in the absence or presence of hGrzB (60 nM) and/or QVD (10uM) and whole-cell lysates were subjected to immunoblot for Bid detecting full length (FL) and cleaved (tBid, p15/p11) with a representative histogram densitometry analysis. Total protein was evaluated by detecting Actin levels. (b) ADA3-KD suppresses perforin/hGrzB-mediated Bid processing. Non-silencing or ADA3-KD HeLa were treated for 10, 30 or 60 min with sublytic perforin in the absence or presence of hGrzB (60 nM) and/or QVD (10 uM) and whole-cell lysates were subjected to immunoblot for Bid detecting full length (FL) and cleaved (tBid, p15/p11) with a representative histogram of densitometry analysis. Total protein was evaluated by detecting Actin levels. (c) PCAF-KD or ADA3-KD suppress perforin/hGrzB-mediated Bid processing at high concentrations of hGrzB. Non-Silencing, PCAF-KD or ADA3-KD HeLa were treated for 10 min with sublytic perforin in the absence or presence of hGrzB at the indicated concentrations and whole-cell lysates were subjected to immunoblot for Bid detecting full length (FL) and cleaved (tBid, p11) with a representative histogram of densitometry analysis. Total protein was evaluated by detecting Actin levels. (d) PCAF- and ADA3-KD suppress perforin/hGrzB-mediated Bid processing. Non-silencing or PCAF- and ADA3-KD HeLa, were treated with sublytic perforin in the absence or presence of hGrzB (60 nM) at the indicated times and total cell lysates were subjected to immunoblot for Bid detecting full length (FL) and cleaved (tBid, p15/p11) with a representative histogram densitometry analysis. Total protein was evaluated by detecting Actin levels.Immunoblots are a representative of three independent experiments, densitometry analysis: a representative of three immunoblots expressed relative to the non-silencing group for each treatment and normalized to the intensity of actin. Error bars represent S.E.M., n=3. Statistical analysis performed: one-way ANOVA versus non-silencing and a Bonferroni test, *P<0.05
Figure 6
Figure 6
PCAF and ADA3 cooperate directly and are nuclear in localization, but no direct interaction with Bid is observed. HeLa wild-type cell lysates were used for immunoprecipitation (IP) and 10% of the input lysate, total IgG or total IP lysate were subjected to immunoblot and probed for the indicated antibody. The 55 kDa band denotes the IgG heavy weight band. (a) PCAF and ADA3 interact directly. Immunoblot for ADA3 IP probed for PCAF. (b) Bid does not interact with PCAF or ADA3. i. Immunoblot for PCAF IP probed for Bid ii. Immunoblot for ADA3 IP probed for Bid and iii. Immunoblot for Bid IP probed for PCAF. (c) PCAF or ADA3 reside in the nucleus. HeLa WT cells were separated for cytoplasmic (C) and nuclear (N) fractions and lysates were subjected to immunoblot: i. Immunoblot probed for PCAF or upstream binding factor (UBF) as a nuclear marker, followed by Bid as a cytosolic marker; ii. Immunoblot probed for ADA3, UBF as a nuclear marker and Bid for a cytosolic marker; iii. HeLa non-silencing or PCAF-KD cells were treated with sublytic perforin in the absence or presence of hGrzB (60 nM) for 15 min and cytoplasmic (C) and nuclear (N) extracts were isolated and subjected to immunoblot for PCAF, UBF as a nuclear marker and Bid for a cytosolic marker. (d) PCAF remains in the nucleus following perforin/hGrzB treatment. i. HeLa wild type (WT), non-silencing or PCAF-KD cells were formaldehyde fixed and stained with PCAF followed by DAPI for nuclear staining. Cells were imaged for the localization of PCAF (red) protein and compared with DAPI (blue) nuclear staining by confocal microscopy, scale bars represent 10 uM. ii. HeLa WT cells treated with sublytic perforin/hGrzB (60 nM) for the indicated times were formaldehyde fixed and stained with PCAF followed by DAPI for nuclear staining. Cells were imaged for PCAF (red) protein localization and compared with DAPI (blue) nuclear staining, by confocal microscopy, scale bars represent 10 uM. Immunoblots and immunofluorescence images are a representative of three independent experiments
Figure 7
Figure 7
Analysis of Bid modifications in PCAF-depleted cells. (a) The phosphorylation of Bid does not change in PCAF-depleted HeLa. Non-silencing or PCAF-KD cells were treated with sublytic perforin in the absence or presence of hGrzB (60 nM) at the indicated times in minutes (min) or etoposide (100 uM) for 20 min and whole-cell lysates were subjected to immunoblot detecting Bid: phospho-S78 (pSer78); phospho-S65 (pSer65); Bid full length (FL) or cleaved (tBid, p11). Tubulin immunoblot served as loading control. (b) Inhibition of the proteasome, does not alter Bid processing in PCAF-KD HeLa. Non-silencing or PCAF-KD were pre-treated with Bortezomib (1 h, 100 uM) as indicated, then with sublytic perforin in the absence or presence of hGrzB (60 nM) at the indicated times in minutes (min) and whole-cell lysates were subjected to immunoblot for Bid detecting full length (FL) and cleaved Bid (tBid, p11) or Ubiquitin (middle panel). Tubulin immunoblot served as loading control. Immunoblots are a representation of three independent experiments
Figure 8
Figure 8
PACS2 depletion in HeLa confers resistance to perforin/hGrzB-mediated cell death and reduced Bid processing. (a) PCAF-KD or ADA3-KD HeLa have reduced PACS2 expression. PCAF-KD, ADA3-KD or non-silencing cells were examined for PACS2 expression by RNA extraction and relative mRNA expression of PACS2 was measured by qRT-PCR. (b) HeLa transduced with PACS2 shRNA have reduced PACS2 expression. RNA was extracted from non-silencing, or PACS2-KD HeLa and relative mRNA expression for PACS2 was detected by qRT-PCR. (c) PACS2-depleted HeLa are resistant to perforin/hGrzB-mediated cell death and have reduced Bid processing. i. PACS2-KD or non–silencing HeLa were treated with sublytic perforin in the absence or presence of hGrzB at 30 nM and 60 nM and a 4 h 51Cr release assay was completed. ii. Non- silencing, or PACS2-KD HeLa were treated for 20 min with sublytic perforin in the absence or presence of hGrzB at the indicated concentrations and whole-cell lysates were subjected to immunoblot for Bid detecting full length (FL) and cleaved (tBid, p11). Total protein was evaluated by detecting Actin levels. (d) A simplified schematic depicting the role that PCAF and ADA3 have in perforin-mediated human perforin/hGrzB-induced cell death and their effect on Bid processing via the transport protein PACS2. The suggested mechanism shows the following: PCAF and ADA3 influence the expression of PACS2; PACS2 binds to full-length Bid and assists in its trafficking and cleavage (tBid) by human GrzB; tBid instigates Bax/Bak oligomerisation which induces mitochondrial outer membrane permeabilisation (MOMP); inducing cytochrome-c release (as well as Smac/Diablo) which activates caspases and leads to cell death. Error bars represent S.E.M., n=3. Statistical analysis performed: one way ANOVA versus non-silencing and a Bonferroni test, **P<0.01

References

    1. Kaiserman D, Bird CH, Sun J, Matthews A, Ung K, Whisstock JC, et al. The major human and mouse granzymes are structurally and functionally divergent. J Cell Biol. 2006;175:619–630. - PMC - PubMed
    1. Kagi D, Ledermann B, Burki K, Seiler P, Odermatt B, Olsen KJ, et al. Cytotoxicity mediated by T cells and natural killer cells is greatly impaired in perforin-deficient mice. Nature. 1994;369:31–37. - PubMed
    1. Heibein JA, Goping IS, Barry M, Pinkoski MJ, Shore GC, Green DR, et al. Granzyme B-mediated cytochrome c release is regulated by the Bcl-2 family members bid and Bax. J Exp Med. 2000;192:1391–1402. - PMC - PubMed
    1. Barry M, Heibein JA, Pinkoski MJ, Lee SF, Moyer RW, Green DR, et al. Granzyme B short-circuits the need for caspase 8 activity during granule-mediated cytotoxic T-lymphocyte killing by directly cleaving Bid. Mol Cell Biol. 2000;20:3781–3794. - PMC - PubMed
    1. Alimonti JB, Shi L, Baijal PK, Greenberg AH. Granzyme B induces BID-mediated cytochrome c release and mitochondrial permeability transition. J Biol Chem. 2001;276:6974–6982. - PubMed

Publication types

MeSH terms

LinkOut - more resources