. 2014 Apr;196(7):1306-17.
doi: 10.1128/JB.01463-13. Epub 2014 Jan 24.

Influence of O polysaccharides on biofilm development and outer membrane vesicle biogenesis in Pseudomonas aeruginosa PAO1

Affiliations

Influence of O polysaccharides on biofilm development and outer membrane vesicle biogenesis in Pseudomonas aeruginosa PAO1

Kathleen Murphy et al. J Bacteriol. 2014 Apr.

Abstract

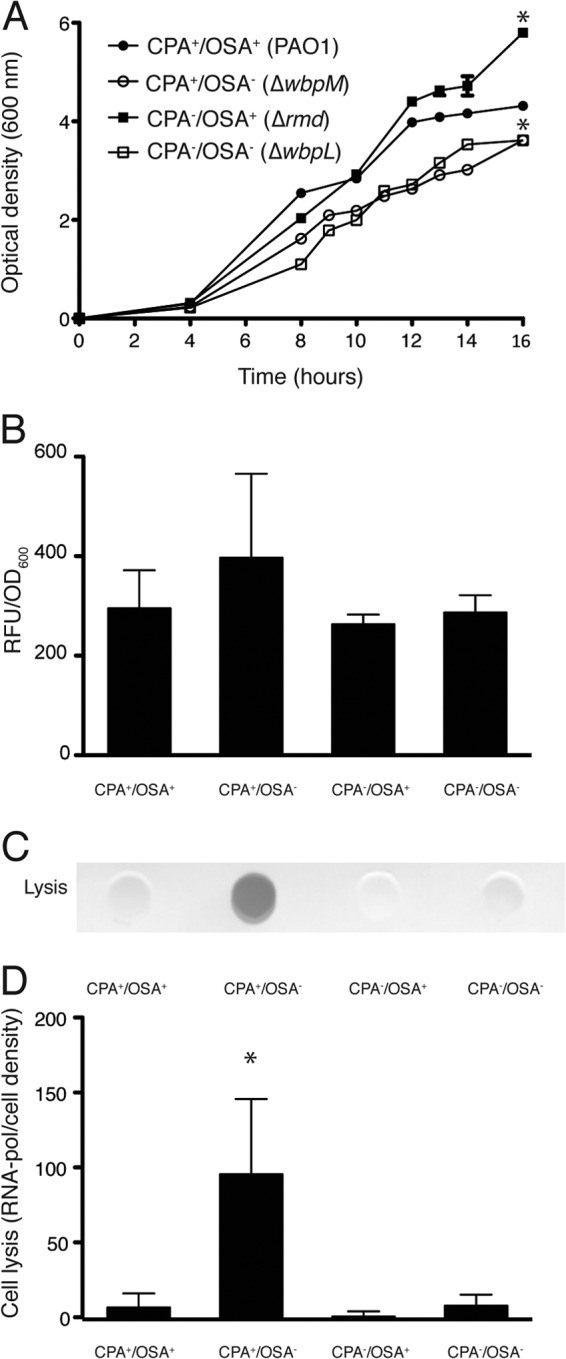
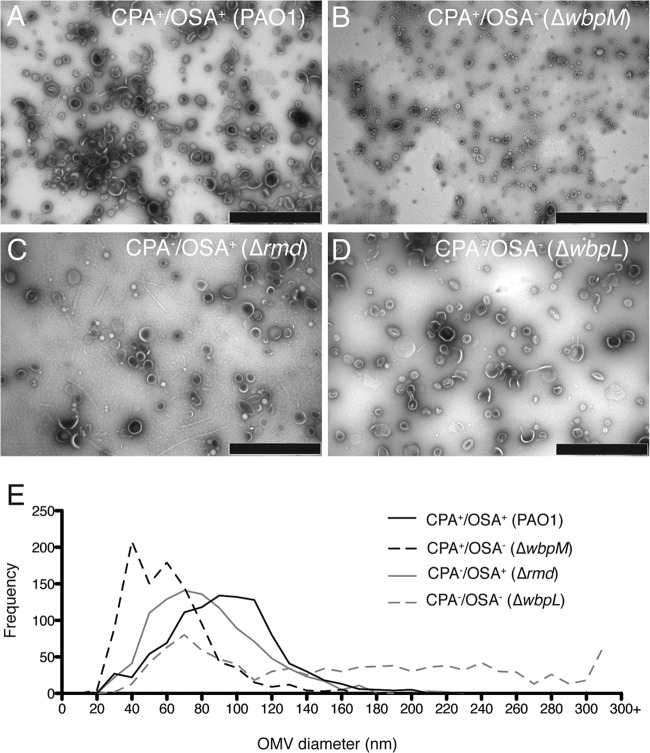
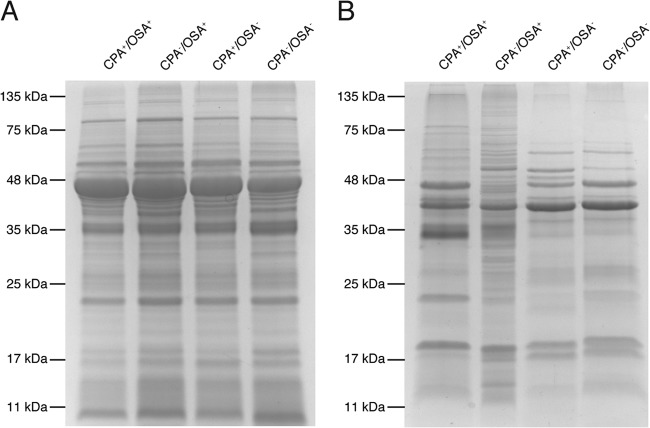
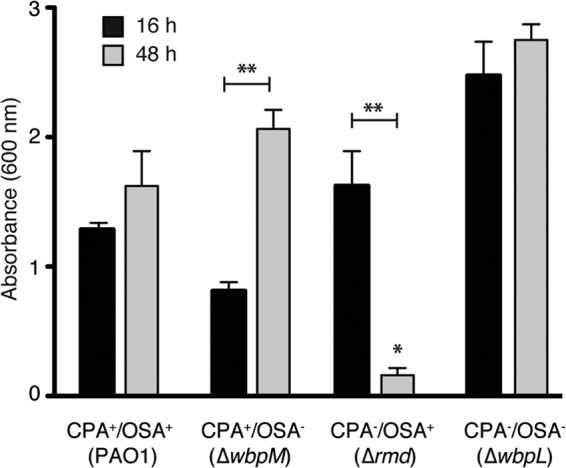
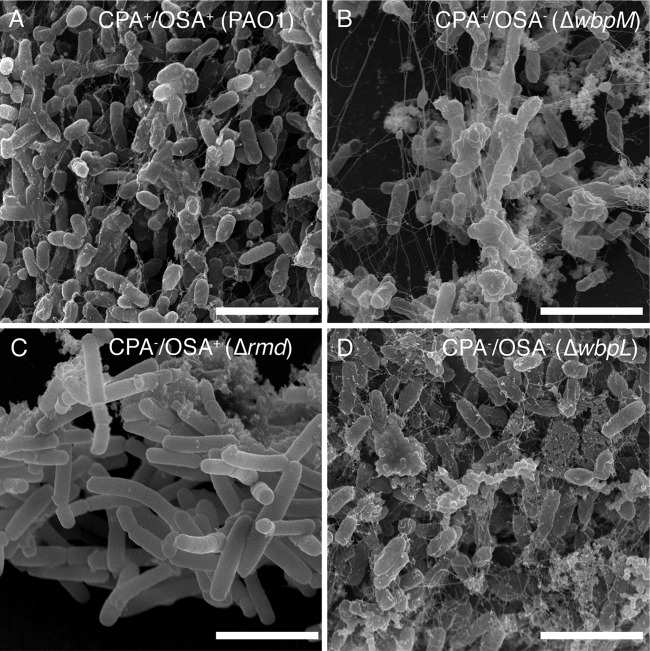
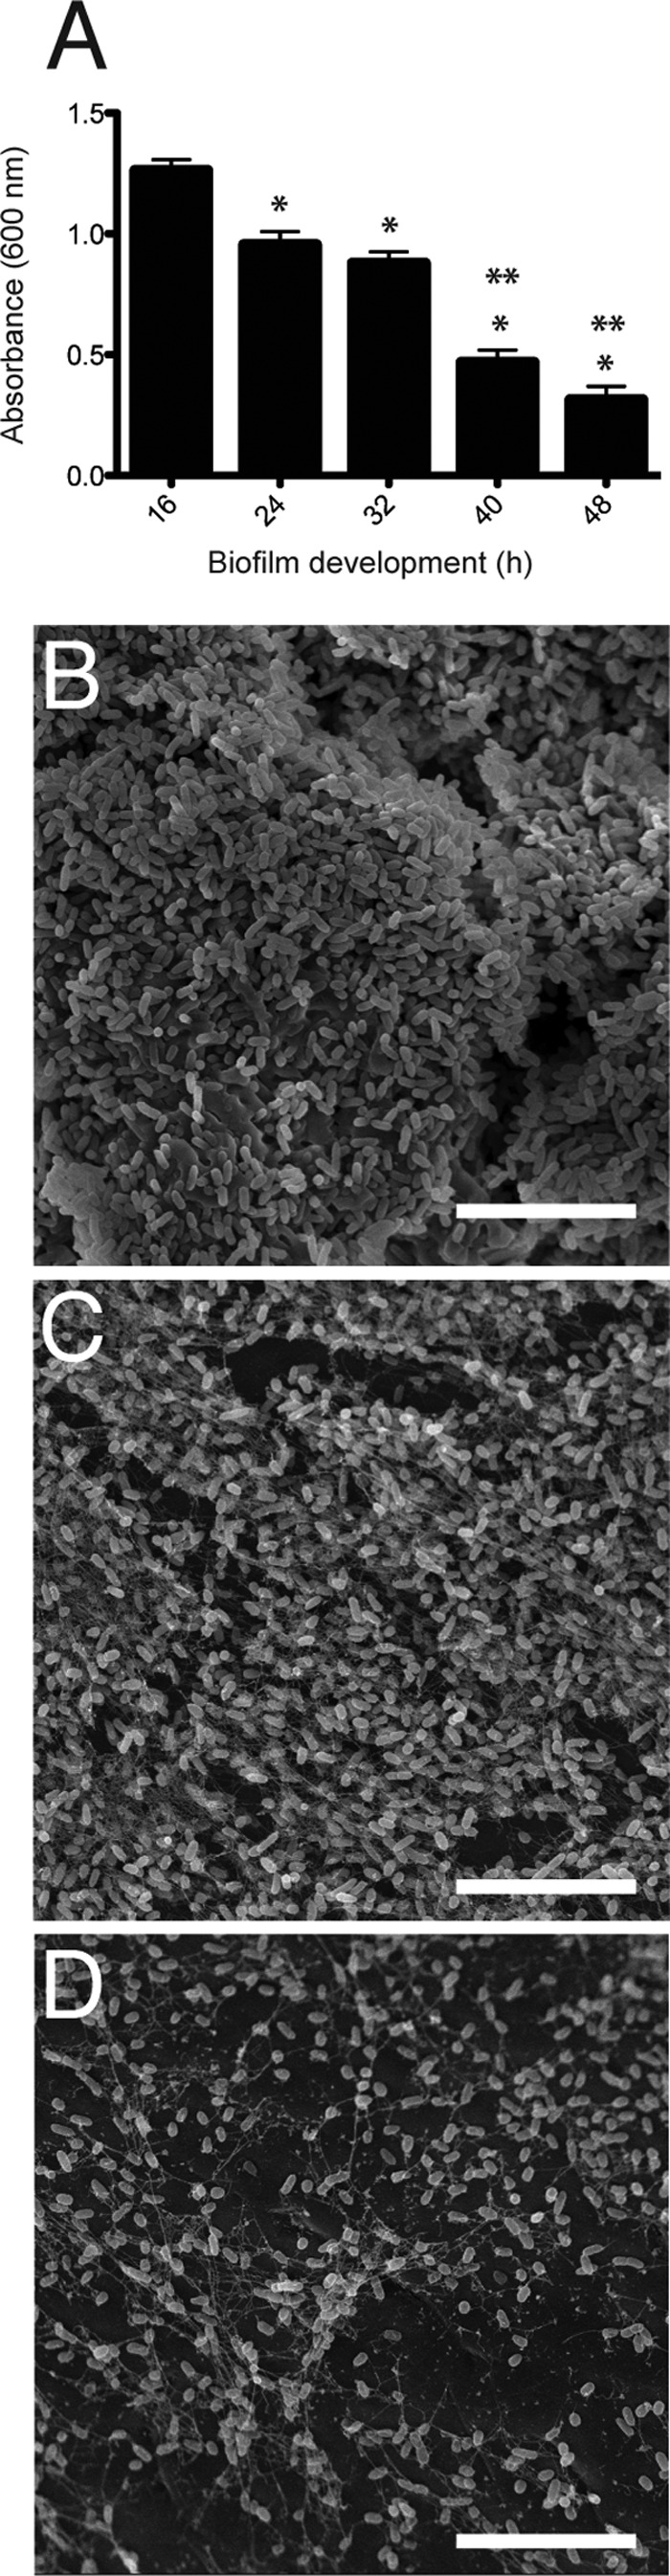
Pseudomonas aeruginosa is a common opportunistic human pathogen known for its ability to adapt to changes in its environment during the course of infection. These adaptations include changes in the expression of cell surface lipopolysaccharide (LPS), biofilm development, and the production of a protective extracellular exopolysaccharide matrix. Outer membrane vesicles (OMVs) have been identified as an important component of the extracellular matrix of P. aeruginosa biofilms and are thought to contribute to the development and fitness of these bacterial communities. The goal of this study was to examine the relationships between changes in the cell surface expression of LPS O polysaccharides, biofilm development, and OMV biogenesis in P. aeruginosa. We compared wild-type P. aeruginosa PAO1 with three chromosomal knockouts. These knockouts have deletions in the rmd, wbpM, and wbpL genes that produce changes in the expression of common polysaccharide antigen (CPA), O-specific antigen (OSA), or both. Our results demonstrate that changes in O polysaccharide expression do not significantly influence OMV production but do affect the size and protein content of OMVs derived from both CPA(-) and OSA(-) cells; these mutant cells also exhibited different physical properties from wild-type cells. We further examined biofilm growth of the mutants and determined that CPA(-) cells could not develop into robust biofilms and exhibit changes in cell morphology and biofilm matrix production. Together these results demonstrate the importance of O polysaccharide expression on P. aeruginosa OMV composition and highlight the significance of CPA expression in biofilm development.


Figures

FIG 1
FIG 1
Cell growth, OMV production, and cell lysis of O polysaccharide mutants. (A) Growth curves for each P. aeruginosa strain cultured in TSB and measured up to 16 h. *, P < 0.05 versus wt. (B) Quantitative assessment of OMV production from 16-h cultures of the P. aeruginosa strains described in panel A using the lipophilic dye FM4-64. (C) Representative dot blot immunoassay (anti-RNA polymerase) demonstrating cell lysis in the cell-free supernatants from cultures described in panel A. (D) Quantitative assessment of cell lysis taken from densitometry readings from dot blot immunoassays (from panel C) *, P < 0.05 versus wt. All experiments were conducted in triplicate, and error bars represent standard deviations.
FIG 2
FIG 2
Size distribution of OMVs from different O polysaccharide mutants. Shown are negatively stained transmission electron micrographs of OMVs purified from 16-h cultures of PAO1 (A), ΔwbpM (B), Δrmd (C), and ΔwbpL (D) cells (bar, 1 μm). (E) Histogram representing the size distribution of OMVs purified from the different P. aeruginosa O polysaccharide-producing strains measured from transmission electron micrographs (n = 1,000 OMV measurements/strain).
FIG 3
FIG 3
Mutations in O polysaccharide expression result in changes in protein content within OMVs. Shown are isolated total membranes (A) and purified OMVs (B) from each P. aeruginosa strain cultured for 16 h and analyzed by Coomassie-stained SDS-PAGE. The total membranes from each strain show no major differences in their compositions, while the purified OMVs demonstrate distinct protein changes.
FIG 4
FIG 4
Protein sorting in OMVs from P. aeruginosa O polysaccharide mutants. Proportion of protein abundance for each P. aeruginosa strain tested separated by the localization of proteins based on the cellular compartment (A) and by PseudoCAP functional classification based on information from the Pseudomonas Genome Database for P. aeruginosa PAO1 (B). Each data set represents proteins identified from two biological replicates. (See Table S1 in the supplemental material for a complete list of proteins identified for each specimen and its corresponding replicates.)
FIG 5
FIG 5
Biofilm formation of PAO1 and O polysaccharide mutants. Quantification of crystal violet staining associated with biofilm formation at 16 h (black bars) and 48 h (gray bars) for the different P. aeruginosa O polysaccharide-producing strains. Values on the y axis result from solubilization of crystal violet and were quantified by determining the A600 (n = 9 independent experiments/strain). *, P < 0.05 versus PAO1 at 48 h; **, P < 0.05 for 16 h versus 48 h within-strain difference. Error bars represent standard deviations.
FIG 6
FIG 6
Scanning electron microscopy of PAO1 and O polysaccharide mutant biofilm production. Micrographs of 16-h (A to D) and 48-h (E to H) biofilms from the different P. aeruginosa O polysaccharide-producing strains. The small white arrows denote irreversibly attached cells, while the white arrowheads denote micro- and macrocolonies. Size bars, 10 μm.
FIG 7
FIG 7
High-magnification scanning electron microscopy of mature biofilms. Shown are micrographs of 48-h biofilms of PAO1 (A), ΔwbpM (B), Δrmd (C), and ΔwbpL (D) biofilms. Size bars, 3 μm.
FIG 8
FIG 8
Biofilm development of P. aeruginosa PAO1 Δrmd. (A) Quantification of crystal violet staining associated with biofilm formation for PAO1 Δrmd between 16 h and 48 h demonstrating the graduate reduction in biofilm over time. Values on the y axis result from solubilization of crystal violet and were quantified by determining the A600 (n = 9 independent experiments/strain). *, P < 0.05 versus Δrmd at 16 h; **, P < 0.05 for 40 h and 48 h versus 32 h. Shown are representative SEM micrographs of Δrmd biofilms cultured for 24 h (B), 32 h (C), and 40 h (D). Representative micrographs for Δrmd biofilms cultured for 16 h and 48 h are found in Fig. 6C and G, respectively. Size bars, 10 μm. Error bars represent standard deviations.

Similar articles

Cited by

References

    1. Mayrand D, Grenier D. 1989. Biological activities of outer membrane vesicles. Can. J. Microbiol. 35:607–613. 10.1139/m89-097 - DOI - PubMed
    1. Brandtzaeg P, Kierulf P, Gaustad P, Skulberg A, Bruun JN, Halvorsen S, Sørensen E. 1989. Plasma endotoxin as a predictor of multiple organ failure and death in systemic meningococcal disease. J. Infect. Dis. 159:195–204. 10.1093/infdis/159.2.195 - DOI - PubMed
    1. Gankema H, Wensink J, Guinée PA, Jansen WH, Witholt B. 1980. Some characteristics of the outer membrane material released by growing enterotoxigenic Escherichia coli. Infect. Immun. 29:704–713 - PMC - PubMed
    1. Hoekstra D, van der Laan JW, de Leij L, Witholt B. 1976. Release of outer membrane fragments from normally growing Escherichia coli. Biochim. Biophys. Acta 455:889–899. 10.1016/0005-2736(76)90058-4 - DOI - PubMed
    1. Beveridge TJ. 1999. Structures of gram-negative cell walls and their derived membrane vesicles. J. Bacteriol. 181:4725–4733 - PMC - PubMed

Publication types

MeSH terms

LinkOut - more resources