. 2014 Mar;12(3):322-34.
doi: 10.1158/1541-7786.MCR-13-0543. Epub 2014 Jan 24.

PAI-1 leads to G1-phase cell-cycle progression through cyclin D3/cdk4/6 upregulation

Affiliations

PAI-1 leads to G1-phase cell-cycle progression through cyclin D3/cdk4/6 upregulation

Evan Gomes Giacoia et al. Mol Cancer Res. 2014 Mar.

Abstract

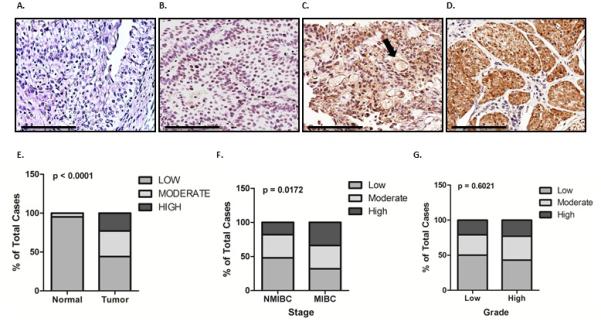
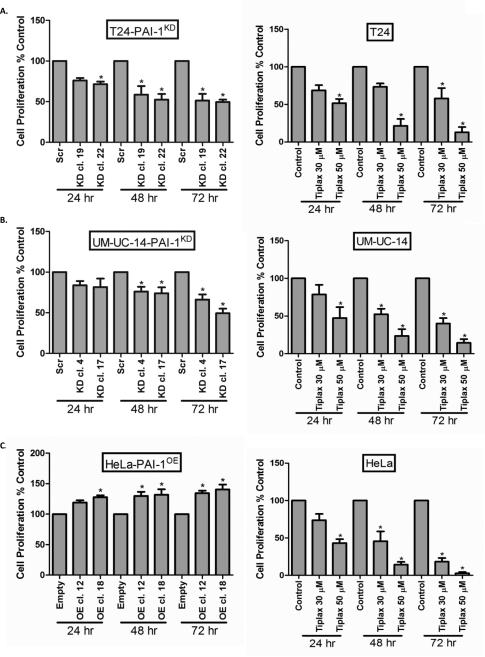
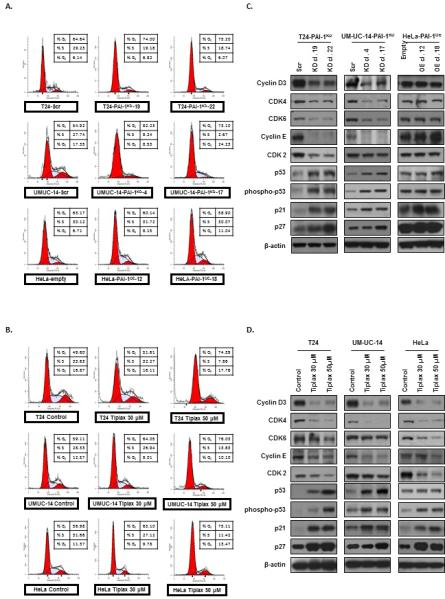
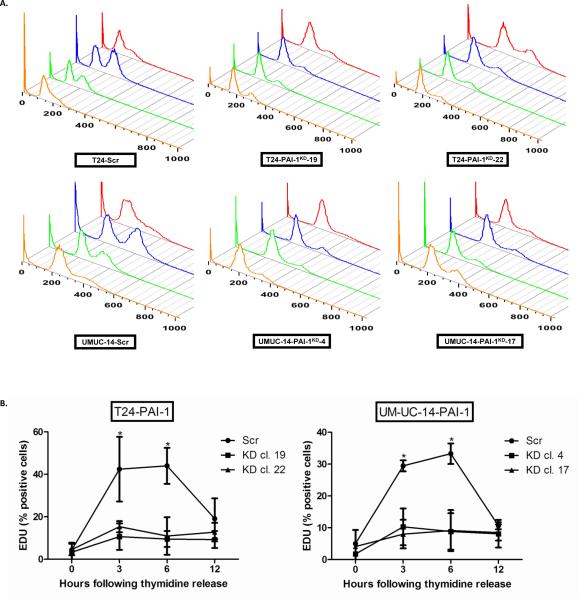
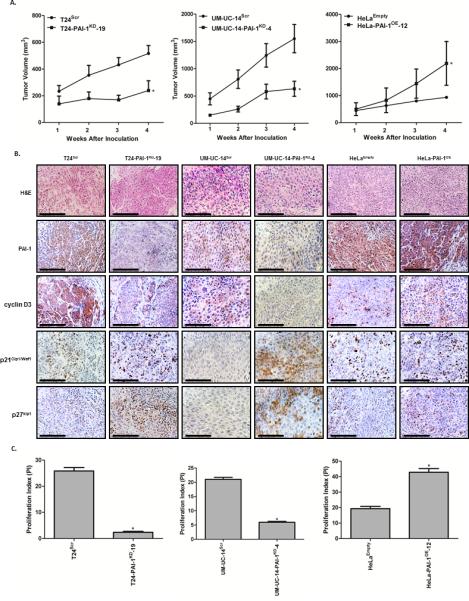
The canonical function of plasminogen activator inhibitor-1 (PAI-1/SERPINE1) is as an inhibitor of urokinase-type plasminogen activator for blood clot maintenance, but it is now also considered a pleiotropic factor that can exert diverse cellular and tumorigenic effects. However, the mechanism controlling its pleiotropic effects is far from being understood. To elucidate the tumorigenic role of PAI-1, we tested the effects of PAI-1 after manipulation of its expression or through the use of a small-molecule inhibitor, tiplaxtinin. Downregulation of PAI-1 significantly reduced cellular proliferation through an inability to progress from the G(0-G1) phase of the cell cycle. Accordingly, overexpression of PAI-1 augmented proliferation by encouraging S-phase entry. Biochemically, cell-cycle arrest was associated with the depletion of the G(1)-phase transition complexes, cyclin D3/cdk4/6 and cyclin E/cdk2, in parallel with the upregulation of the cell-cycle inhibitors p53, p21Cip1/Waf1, and p27Kip1. PAI-1 depletion significantly decreased the tumor size of urothelial T24 and UM-UC-14 xenografts, and overexpression of PAI-1 substantially increased the tumor size of HeLa xenografts. Finally, immunohistochemical analysis of human bladder and cervical tumor tissue microarrays revealed increased expression of PAI-1 in cancerous tissue, specifically in aggressive tumors, supporting the relevance of this molecule in human tumor biology.

Implications: Targeting PAI-1 has beneficial antitumoral effects and should be further investigated clinically.


Figures

Figure 1
Figure 1. PAI-1 overexpression in human bladder cancer
PAI-1 levels were measured by immunohistochemical analysis of 37 benign bladder and 163 bladder tumor tissues. Representative PAI-1 expression levels are shown in benign (A) and bladder cancer tissue samples with absent (B), weak (C), and strong (D) staining. Scale bars, 100 μm. Arrows depict stromal tissue. Correlation was assessed between PAI-1 expression among benign vs. cancer tissue (E) non-muscle invasive bladder cancer (NMIBC) vs. muscle invasive bladder cancer (MIBC) (F) and high-grade vs. low-grade (G).
Figure 2
Figure 2. Depletion of PAI-1 in human tumor cell lines inhibits cell proliferation
Proliferation rates were measured in cancer cell clones T24-PAI-1KD (A), UM-UC-14-PAI-1KD (B) and HeLa-PAI-1OE (C) over a 72 hr period. Similarly, proliferation rates were measured in parental T24 (A), UM-UC-14 (B) and HeLa (C) cells without and with tiplaxtinin at 30 and 50 μM over a 72 hr period. Data were represented as mean ± SD relative to untreated cells, which are set to 100%. Three independent experiments were performed in triplicate. Significance compared to control cells is denoted by *, p < 0.05.
Figure 3
Figure 3. Inhibition of PAI-1 promotes cell cycle arrest by depleting cell cycle regulatory proteins associated with G1/S transition
A. Cell cycle progression was examined by flow cytometry in generated T24 clones (T24Scr, T24-PAI-1KD-19 and T24-PAI-1KD-22), UM-UC-14 clones (UM-UC-14Scr, UM-UC-14-PAI-1KD-4 and UMUC14-PAI-1KD-17) both depleted of PAI-1, in addition to HeLa clones (HeLaEmpty, HeLa-PAI-1OE-12 and HeLa-PAI-1OE-18) overexpressing PAI-1. B. Furthermore cell cycle progression was noted in parental cells (T24, UM-UC-14, and HeLa) treated with tiplaxtinin. All experiments were repeated at least three times and a representative of one experiment is depicted. The percentage of cells in G0/G1, S, and G2/M phase of the cell cycle were observed by flow cytometry after propidium iodide staining of cellular DNA and analyzed by the ModFit software. Expression levels of several known G0/G1, S, and G2/M phase cell cycle regulatory factors were analyzed by immunoblotting of clones in C and parental cells treated with tiplaxtinin in D.
Figure 4
Figure 4. Depletion of PAI-1 prevents passage of tumor cells out of G1 phase of cell cycle
A. T24 clones (T24Scr, T24-PAI-1KD-19 and T24-PAI-1KD-22) and UM-UC-14 clones (UM-UC-14Scr, UM-UC-14-PAI-1KD-4 and UMUC14-PAI-1KD-17) were synchronized in G0/G1 via a double thymidine block and cell cycle progression was monitored following thymidine release by propidium iodide staining by flow cytometry analysis at 0 (orange), 3 (green), 6 (blue) and 12 hrs (red). All experiments were repeated at least three times and a representative of one experiment is depicted. B. The percentage of cells entering S phase was quantified using the Click-iT® EdU Alexa Fluor® 647 Flow Cytometry Assay Kit. Incorporation of 5-ethynyl-2′-deoxyuridine (EDU) was examined in cells at 0, 3, 6, and 12 hrs post release of thymidine block. All experiments were repeated at least three times. All data are presented as mean + SD. *, p < 0.05, relative to control.
Figure 5
Figure 5. PAI-1 knockdown results in reduction of xenograft tumor growth
A, Tumor growth of human xenografts were assessed in vivo in athymic nude mice in the PAI-1 T24 cells (T24Scr and T24-PAI-1KD-19) and UM-UC-14 cells (UM-UC-14Scr and UM-UC-14-PAI-1KD-4). In addition, PAI-1 overexpressing cells (HeLa-PAI-1OE-12 and HeLaEmpty) were evaluated (n = 10 per group). Tumor volumes were measured weekly for four weeks and plotted as mean ± SD. *, p < 0.05, relative to control. B, Tumors were resected, fixed in 10% buffered formalin, embedded in paraffin. H&E images are included to identify and define tumor histology. Immunohistochemical analysis of xenograft tumors (T24Scr, T24-PAI-1KD-19, UM-UC-14Scr, UM-UC-14-PAI-1KD-4, HeLaEmpty and HeLa-PAI-1OE-12) for PAI-1, cyclin D3, p21Cip1/Waf1 and p27kip1 was conducted. Representative images from the four groups along are illustrated. These in vivo results confirmed our in vitro results; PAI-1 correlates with cyclin D3 expression and inversely correlates with p21Cip1/Waf1 and p27kip1expression. C, Proliferative index (PI) was quantified based on Ki-67 staining in each group. All data are presented as mean + SD. *, p < 0.05, relative to control.

Similar articles

Cited by

References

    1. Lee CC, Huang TS. Plasminogen Activator Inhibitor-1: The Expression, Biological Functions, and Effects on Tumorigenesis and Tumor Cell Adhesion and Migration. Journal of Cancer Molecules. 2005;1:25–36.
    1. Wilkins-Port CE, Freytag J, Higgins SP, Higgins PJ. PAI-1: A Multifunctional SERPIN with Complex Roles in Cell Signaling and Migration. Cell Communication Insights. 2010;3:1–10.
    1. Lijnen HR. Pleiotropic functions of plasminogen activator inhibitor-1. Thromb Haemost. 2005;3:35–45. - PubMed
    1. Jankun J, Keck RW, Skrzypczak-Jankun E, Swiercz R. Inhibitors of urokinase reduce size of prostate cancer xenografts in severe combined immunodeficient mice. Cancer Res. 1997;57:559–63. - PubMed
    1. McMahon GA, Petitclerc E, Stefansson S, Smith E, Wong MK, Westrick RJ, et al. Plasminogen activator inhibitor-1 regulates tumor growth and angiogenesis. J Biol Chem. 2001;276:33964–8. - PubMed

Publication types

MeSH terms