

Modeling within-host effects of drugs on Plasmodium falciparum transmission and prospects for malaria elimination
- PMID: 24465196
- PMCID: PMC3900379
- DOI: 10.1371/journal.pcbi.1003434
Modeling within-host effects of drugs on Plasmodium falciparum transmission and prospects for malaria elimination
Abstract
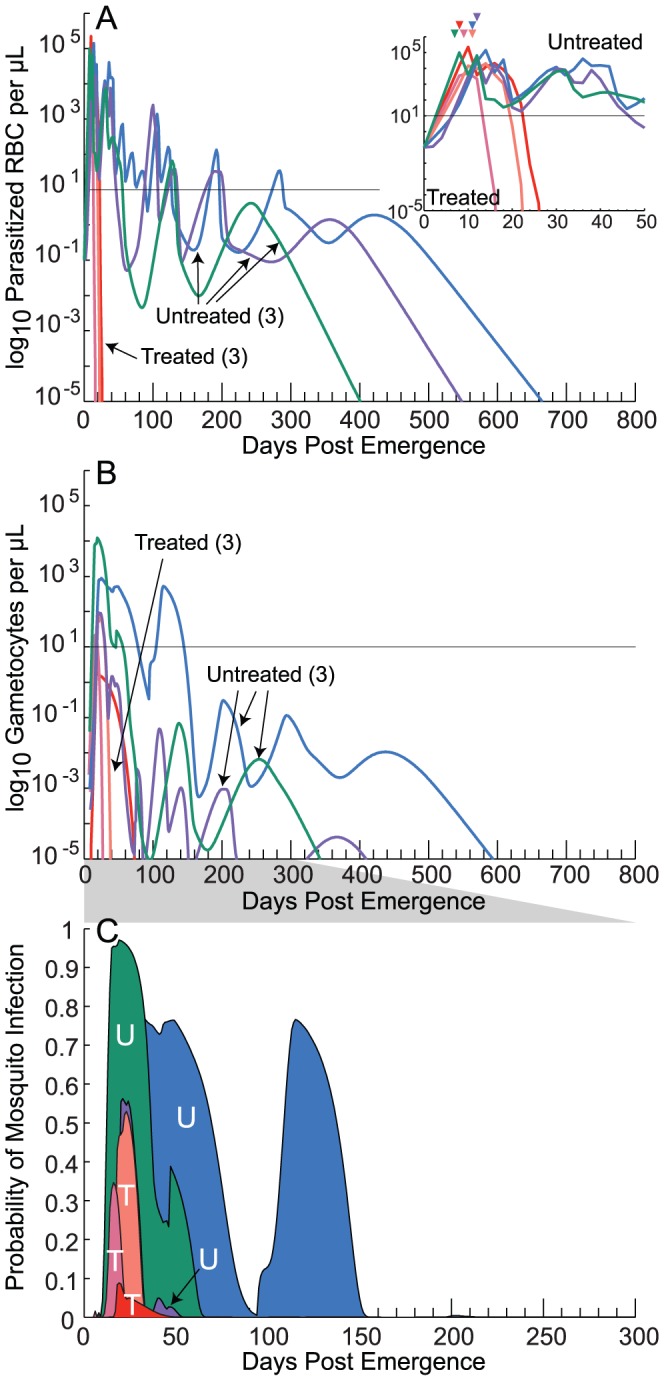
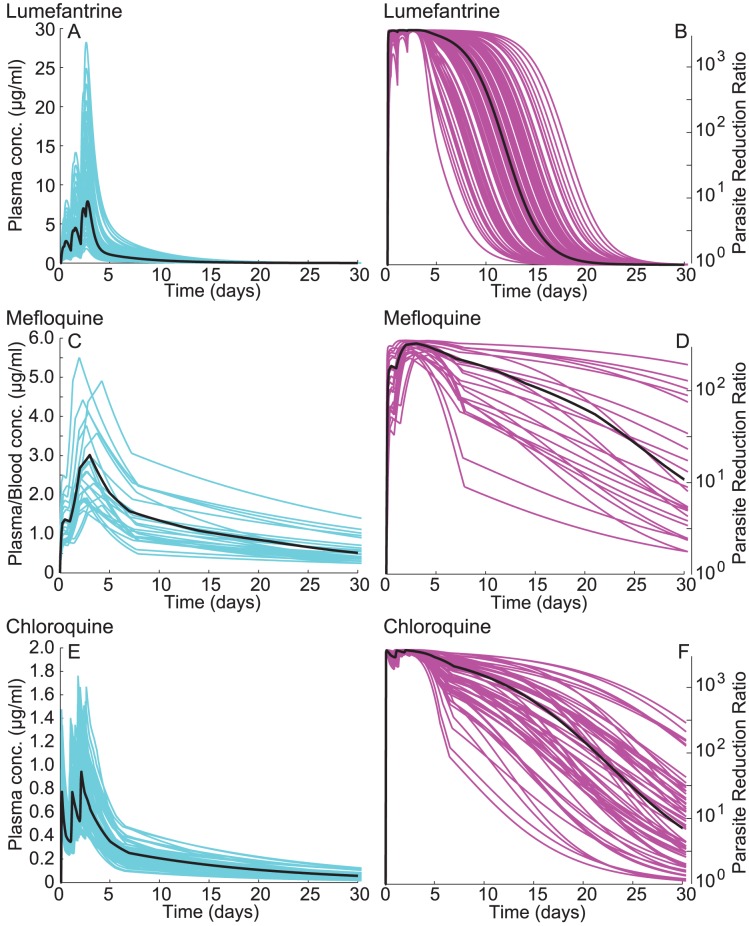
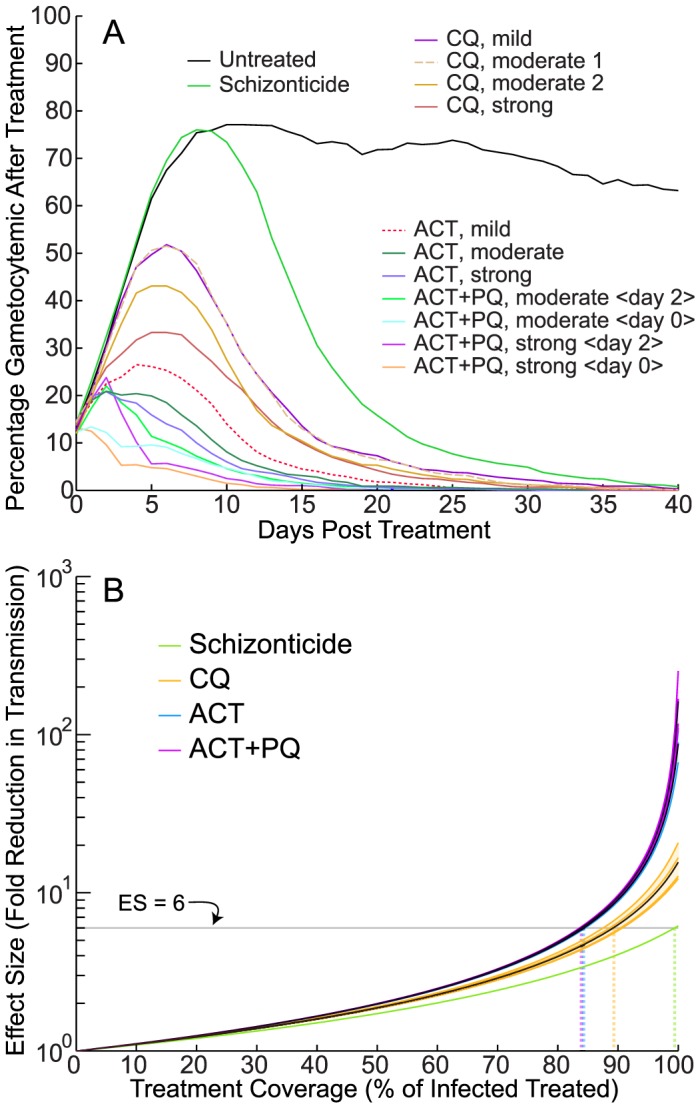
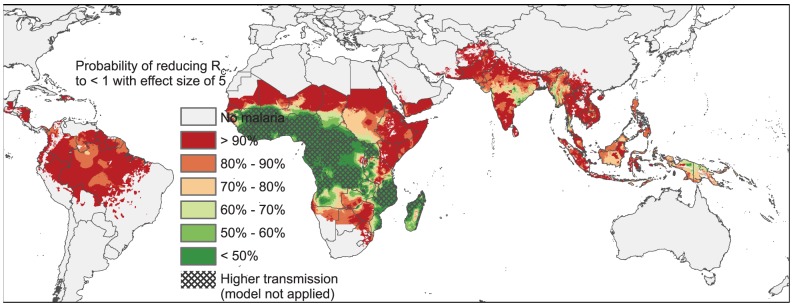
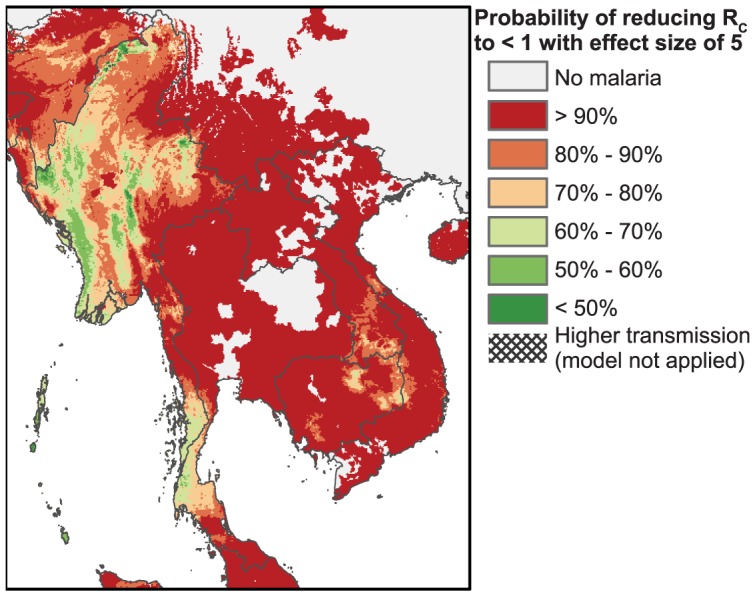
Achieving a theoretical foundation for malaria elimination will require a detailed understanding of the quantitative relationships between patient treatment-seeking behavior, treatment coverage, and the effects of curative therapies that also block Plasmodium parasite transmission to mosquito vectors. Here, we report a mechanistic, within-host mathematical model that uses pharmacokinetic (PK) and pharmacodynamic (PD) data to simulate the effects of artemisinin-based combination therapies (ACTs) on Plasmodium falciparum transmission. To contextualize this model, we created a set of global maps of the fold reductions that would be necessary to reduce the malaria R C (i.e. its basic reproductive number under control) to below 1 and thus interrupt transmission. This modeling was applied to low-transmission settings, defined as having a R 0<10 based on 2010 data. Our modeling predicts that treating 93-98% of symptomatic infections with an ACT within five days of fever onset would interrupt malaria transmission for ∼91% of the at-risk population of Southeast Asia and ∼74% of the global at-risk population, and lead these populations towards malaria elimination. This level of treatment coverage corresponds to an estimated 81-85% of all infected individuals in these settings. At this coverage level with ACTs, the addition of the gametocytocidal agent primaquine affords no major gains in transmission reduction. Indeed, we estimate that it would require switching ∼180 people from ACTs to ACTs plus primaquine to achieve the same transmission reduction as switching a single individual from untreated to treated with ACTs. Our model thus predicts that the addition of gametocytocidal drugs to treatment regimens provides very small population-wide benefits and that the focus of control efforts in Southeast Asia should be on increasing prompt ACT coverage. Prospects for elimination in much of Sub-Saharan Africa appear far less favorable currently, due to high rates of infection and less frequent and less rapid treatment.
Conflict of interest statement
The authors have declared that no competing interests exist.
Figures
Similar articles
-
Optimally timing primaquine treatment to reduce Plasmodium falciparum transmission in low endemicity Thai-Myanmar border populations.Malar J. 2009 Jul 15;8:159. doi: 10.1186/1475-2875-8-159. Malar J. 2009. PMID: 19604346 Free PMC article.
-
Folic acid supplementation and malaria susceptibility and severity among people taking antifolate antimalarial drugs in endemic areas.Cochrane Database Syst Rev. 2022 Feb 1;2(2022):CD014217. doi: 10.1002/14651858.CD014217. Cochrane Database Syst Rev. 2022. PMID: 36321557 Free PMC article.
-
Strategic use of antimalarial drugs that block falciparum malaria parasite transmission to mosquitoes to achieve local malaria elimination.Parasitol Res. 2014 Oct;113(10):3535-46. doi: 10.1007/s00436-014-4091-6. Epub 2014 Sep 4. Parasitol Res. 2014. PMID: 25185662 Review.
-
Malaria's missing number: calculating the human component of R0 by a within-host mechanistic model of Plasmodium falciparum infection and transmission.PLoS Comput Biol. 2013 Apr;9(4):e1003025. doi: 10.1371/journal.pcbi.1003025. Epub 2013 Apr 18. PLoS Comput Biol. 2013. PMID: 23637586 Free PMC article.
-
Modelling the impact of artemisinin combination therapy and long-acting treatments on malaria transmission intensity.PLoS Med. 2008 Nov 25;5(11):e226; discussion e226. doi: 10.1371/journal.pmed.0050226. PLoS Med. 2008. PMID: 19067479 Free PMC article.
Cited by
-
Efficacy of Single-Dose Primaquine With Artemisinin Combination Therapy on Plasmodium falciparum Gametocytes and Transmission: An Individual Patient Meta-Analysis.J Infect Dis. 2022 Apr 1;225(7):1215-1226. doi: 10.1093/infdis/jiaa498. J Infect Dis. 2022. PMID: 32778875 Free PMC article.
-
Malaria Molecular Epidemiology: Lessons from the International Centers of Excellence for Malaria Research Network.Am J Trop Med Hyg. 2015 Sep;93(3 Suppl):79-86. doi: 10.4269/ajtmh.15-0005. Epub 2015 Aug 10. Am J Trop Med Hyg. 2015. PMID: 26259945 Free PMC article.
-
Gametocyte carriage in uncomplicated Plasmodium falciparum malaria following treatment with artemisinin combination therapy: a systematic review and meta-analysis of individual patient data.BMC Med. 2016 May 24;14:79. doi: 10.1186/s12916-016-0621-7. BMC Med. 2016. PMID: 27221542 Free PMC article.
-
The Gametocytocidal Efficacy of Different Single Doses of Primaquine with Dihydroartemisinin-piperaquine in Asymptomatic Parasite Carriers in The Gambia: A Randomized Controlled Trial.EBioMedicine. 2016 Nov;13:348-355. doi: 10.1016/j.ebiom.2016.10.032. Epub 2016 Oct 23. EBioMedicine. 2016. PMID: 27825738 Free PMC article. Clinical Trial.
-
Population-level impact of mass drug administration against schistosomiasis with anthelmintic drugs targeting juvenile schistosomes: a modelling study.Lancet Microbe. 2025 Jul;6(7):101065. doi: 10.1016/j.lanmic.2024.101065. Epub 2025 May 21. Lancet Microbe. 2025. PMID: 40412412 Free PMC article.
References
-
- WHO (2012) World malaria report: 2012. Switzerland: WHO Press.
-
- Murray CJL, Rosenfeld LC, Lim SS, Andrews KG, Foreman KJ, et al. (2012) Global malaria mortality between 1980 and 2010: a systematic analysis. Lancet 379: 413–431 - PubMed
-
- White NJ (2008) Qinghaosu (artemisinin): the price of success. Science 320: 330–334 - PubMed
Publication types
MeSH terms
Substances
Grants and funding
LinkOut - more resources
Full Text Sources
Other Literature Sources
