. 2014 Jan;10(1):e1003446.
doi: 10.1371/journal.pcbi.1003446. Epub 2014 Jan 23.

Leadership and path characteristics during walks are linked to dominance order and individual traits in dogs

Affiliations

Leadership and path characteristics during walks are linked to dominance order and individual traits in dogs

Zsuzsa Ákos et al. PLoS Comput Biol. 2014 Jan.

Abstract

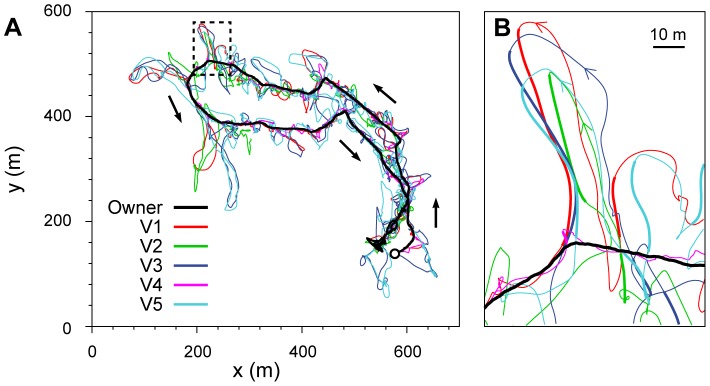
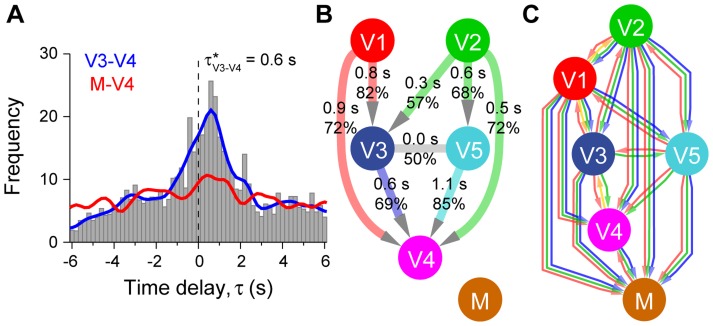
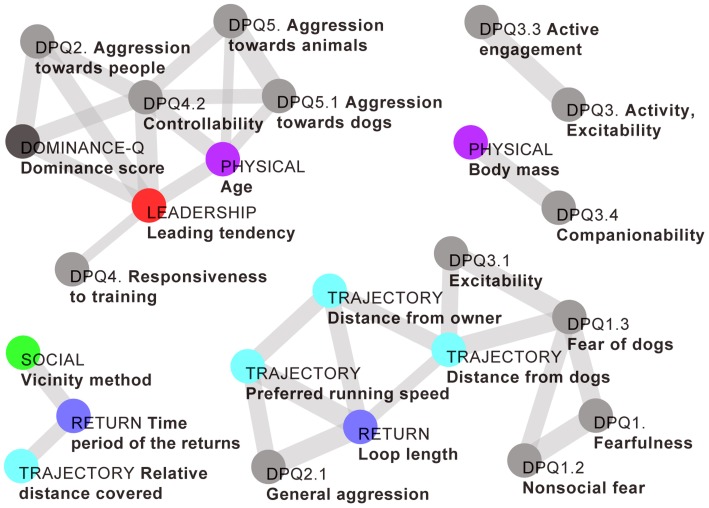
Movement interactions and the underlying social structure in groups have relevance across many social-living species. Collective motion of groups could be based on an "egalitarian" decision system, but in practice it is often influenced by underlying social network structures and by individual characteristics. We investigated whether dominance rank and personality traits are linked to leader and follower roles during joint motion of family dogs. We obtained high-resolution spatio-temporal GPS trajectory data (823,148 data points) from six dogs belonging to the same household and their owner during 14 30-40 min unleashed walks. We identified several features of the dogs' paths (e.g., running speed or distance from the owner) which are characteristic of a given dog. A directional correlation analysis quantifies interactions between pairs of dogs that run loops jointly. We found that dogs play the role of the leader about 50-85% of the time, i.e. the leader and follower roles in a given pair are dynamically interchangable. However, on a longer timescale tendencies to lead differ consistently. The network constructed from these loose leader-follower relations is hierarchical, and the dogs' positions in the network correlates with the age, dominance rank, trainability, controllability, and aggression measures derived from personality questionnaires. We demonstrated the possibility of determining dominance rank and personality traits of an individual based only on its logged movement data. The collective motion of dogs is influenced by underlying social network structures and by characteristics such as personality differences. Our findings could pave the way for automated animal personality and human social interaction measurements.


Conflict of interest statement

The authors have declared that no competing interests exist.

Figures

Figure 1
Figure 1. A typical walk of the group and the illustration of returning loops.
(A) Highly detailed trajectories of the dogs (only Vizslas are shown) and of the owner during a 30-minute walk. Arrows indicate the direction of motion. (B) The dogs run in loops and return from time to time to the owner. Thickened segments of the tracks show when a dog's return to its owner was found by our automated method.
Figure 2
Figure 2. Directional correlations between tracks of dog pairs, the resulting leadership network and the results of the dominance questionnaire.
(A) Directional correlation delay time (τ) values for a given pair (V3 and V4) when high correlation was found for a time window shown by the grey histogram, while the blue curve shows the function gained by Gaussian smoothing with σ = 0.3 s. The distribution shows a clear peak at τ* = 0.6 s. For a comparison, the red curve shows a directional correlation delay time function for another pair (M and V4), where no connection was found between the two dogs in the absence of a significant peak. (B) Summarised leadership network composed of the directional delay time values. Each directed link points from the individual that plays the role of the leader more often in the given relationship toward the follower. The grey link shows a strong connection between V3 and V5 with an evenly matched relationship (τ* = 0 s). The upper values on the edges indicate the mode of time delays in seconds and the lower values show the average portion that the leader of that pair was actually leading. Note that these modes are from wide distributions (as shown on panel A) with an average full width at half maximum of 3.7 s. The mixed-breed (M) is not connected to any Vizslas, and so is not part of the network. This network is used to calculate leading tendency, which is the number of followers that can be reached travelling through directed links. (C) Dominance network between the dogs derived from the dominance questionnaire . Each directed edge points from the dominant individual toward the subordinate one. The colours represent the context when dominance is evident: red: barking, orange: licking the mouth, green: eating and blue: fighting (see more details in Text S1). The nodes were arranged in the vertical direction in such a way that more edges point downwards than upwards between all pairs.
Figure 3
Figure 3. Significant correlations of variables calculated from trajectory data with the personality traits of the dogs measured by questionnaires.
The figure shows the significant correlations (where p<0.05) between the variables (edge width indicating the strength of correlation) calculated for the Vizslas (n = 5). The first term of each name and the colouring of the nodes show the origin of each variable: DPQ: Dog Personality Questionnaire (; gray), Dominance-Q: dominance questionnaire (; dark gray); Physical: physical attributes of the dogs (purple); Trajectory: simple characteristics from the trajectories (cyan); Return: relevant characteristics of the returns to the owner (blue); Social: number of social connection to other dogs calculated from trajectories (green); Leadership: leadership hierarchy from directional correlation delays (red). Only those questionnaire variables are shown which had significant correlation with any variable of another type. All connections are shown between the variables presented on the plot.

References

    1. Conradt L, Roper TJ (2009) Conflicts of interest and the evolution of decision sharing. Philos Trans R Soc Lond B Biol Sci 364: 807–819 - PMC - PubMed
    1. Sumpter DJT, Pratt SC (2009) Quorum responses and consensus decision making. Philos Trans R Soc Lond B Biol Sci 364: 743–753 - PMC - PubMed
    1. Krause J, Hoare D, Krause S, Hemelrijk CK, Rubenstein DI (2000) Leadership in fish shoals. Fish Fish 1: 82–89
    1. Drews C (1993) The concept and definition of dominance in animal behaviour. Behaviour 125: 283–313
    1. King AJ, Cowlishaw G (2009) All together now: behavioural synchrony in baboons. Anim Behav 78: 1381–1387

LinkOut - more resources