. 2014 Jan;10(1):e1003457.
doi: 10.1371/journal.pcbi.1003457. Epub 2014 Jan 23.

Bayesian reconstruction of disease outbreaks by combining epidemiologic and genomic data

Affiliations

Bayesian reconstruction of disease outbreaks by combining epidemiologic and genomic data

Thibaut Jombart et al. PLoS Comput Biol. 2014 Jan.

Abstract

Recent years have seen progress in the development of statistically rigorous frameworks to infer outbreak transmission trees ("who infected whom") from epidemiological and genetic data. Making use of pathogen genome sequences in such analyses remains a challenge, however, with a variety of heuristic approaches having been explored to date. We introduce a statistical method exploiting both pathogen sequences and collection dates to unravel the dynamics of densely sampled outbreaks. Our approach identifies likely transmission events and infers dates of infections, unobserved cases and separate introductions of the disease. It also proves useful for inferring numbers of secondary infections and identifying heterogeneous infectivity and super-spreaders. After testing our approach using simulations, we illustrate the method with the analysis of the beginning of the 2003 Singaporean outbreak of Severe Acute Respiratory Syndrome (SARS), providing new insights into the early stage of this epidemic. Our approach is the first tool for disease outbreak reconstruction from genetic data widely available as free software, the R package outbreaker. It is applicable to various densely sampled epidemics, and improves previous approaches by detecting unobserved and imported cases, as well as allowing multiple introductions of the pathogen. Because of its generality, we believe this method will become a tool of choice for the analysis of densely sampled disease outbreaks, and will form a rigorous framework for subsequent methodological developments.


Conflict of interest statement

The authors have declared that no competing interests exist.

Figures

Figure 1
Figure 1. Quality of the transmission tree reconstruction in simulated datasets.
This violinplot represents the proportion of correctly inferred transmissions in the consensus ancestries, obtained by retaining the most frequent infectors in the posterior trees for each case. Each colored ‘violin’ represents the density of points for a given simulation setting, indicated on the x-axis (see Table 1 for details).
Figure 2
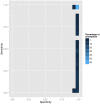
Figure 2. Detection of imported cases.
This figure shows the specificity and sensitivity of the procedure for detecting imported cases based on the identification of genetic outliers. Colored rectangles represent the percentage of simulations within a given specificity/sensitivity range. All simulation settings were pooled for this analysis.
Figure 3
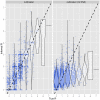
Figure 3. Inference of individual effective reproduction numbers.
This violinplot shows the estimates of individual effective reproduction numbers (R) for simulated outbreaks with the ‘Base’ setting (see Table 1), based on 50 simulated epidemics, with (left) or without (right) using genetic information in the model. Each dot represents an infected individual. The dashed line indicates identity.
Figure 4
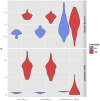
Figure 4. Detection of group-level heterogeneity in infectivity.
This violinplot shows actual and estimated values of effective reproduction numbers (R) at an individual level, for outbreaks simulated with two groups of hosts having contrasted infectivity (‘Low’ and ‘high’). The top panel corresponds to simulations with equally-sized groups (‘Low/high settings’), while the bottom panel corresponds to simulations with super-spreaders.
Figure 5
Figure 5. Results of the analysis of the SARS data using outbreaker.
This figure summarizes the reconstruction of the outbreak, showing putative transmissions (arrows) amongst individuals (rows). Arrows represent ancestries with a least 5% of support in the posterior distributions, while boxes correspond to the posterior distributions of the infection dates. Arrows are annotated by number of mutations and posterior support of the ancestries, and colored by numbers of mutations, with lighter shades of grey for larger genetic distances. The actual sequence collection dates are plotted as plain black dots. Bubbles are used to represent the generation time distribution, with larger disks used for greater infectivity. Shades of blue indicate the degree of certainty for inferring the origin of different cases, as measured by the entropy of ancestries (see methods and equation 12): blue represents conclusive identification of the ancestor of the case (low entropy), while grey shades are uncertain (high entropy).
Figure 6
Figure 6. Consensus transmission tree reconstruction of the SARS outbreak.
This figure indicates the most supported transmission tree reconstructed by outbreaker. Cases are represented by spheres colored according to their collection dates. Edges are colored according to the corresponding numbers of mutations, with lighter shades of grey for larger numbers. Edge annotations indicate numbers of mutations and frequencies of the ancestries in the posterior samples.

References

    1. Haydon DT, Chase-Topping M, Shaw DJ, Matthews L, Friar JK, et al. (2003) The construction and analysis of epidemic trees with reference to the 2001 UK foot-and-mouth outbreak. Proc Biol Sci 270: 121–127 - PMC - PubMed
    1. Cauchemez S, Boelle PY, Donnelly CA, Ferguson NM, Thomas G, et al. (2006) Real-time estimates in early detection of SARS. Emerg Infect Dis 12: 110–113 - PMC - PubMed
    1. Wallinga J, Lipsitch M (2007) How generation intervals shape the relationship between growth rates and reproductive numbers. Proc Biol Sci 274: 599–604 - PMC - PubMed
    1. Cauchemez S, Ferguson NM (2011) Methods to infer transmission risk factors in complex outbreak data. J R Soc Interface 9: 456–469 - PMC - PubMed
    1. Cauchemez S, Bhattarai A, Marchbanks TL, Fagan RP, Ostroff S, et al. (2011) Role of social networks in shaping disease transmission during a community outbreak of 2009 H1N1 pandemic influenza. Proc Natl Acad Sci U S A 108: 2825–2830 - PMC - PubMed

Publication types