

First eddy covariance flux measurements by PTR-TOF
- PMID: 24465280
- PMCID: PMC3898015
- DOI: 10.5194/amt-3-387-2010
First eddy covariance flux measurements by PTR-TOF
Abstract
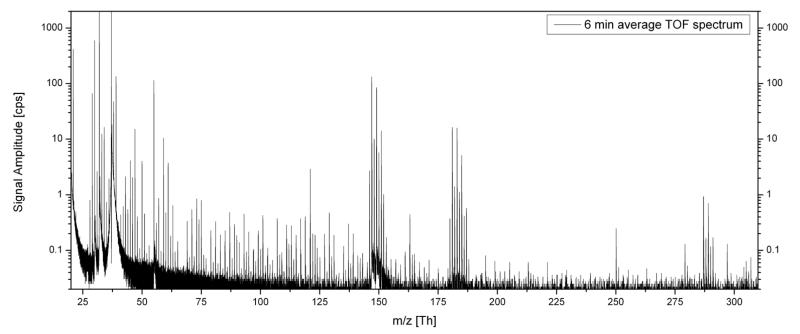
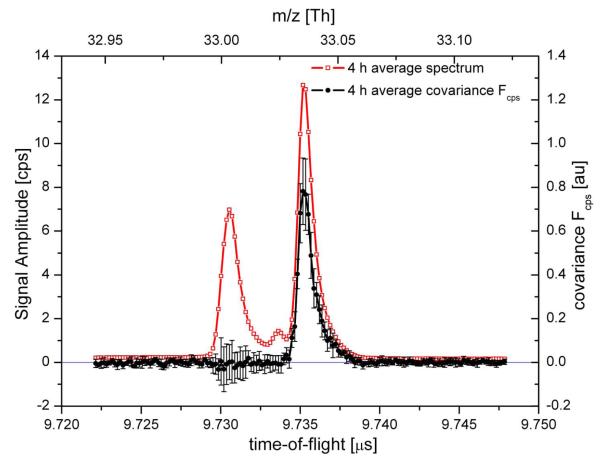
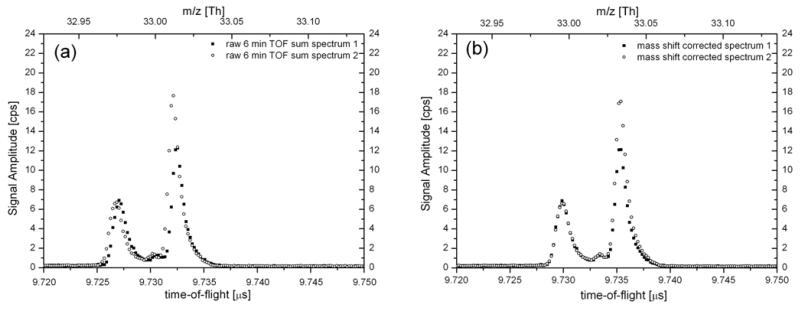
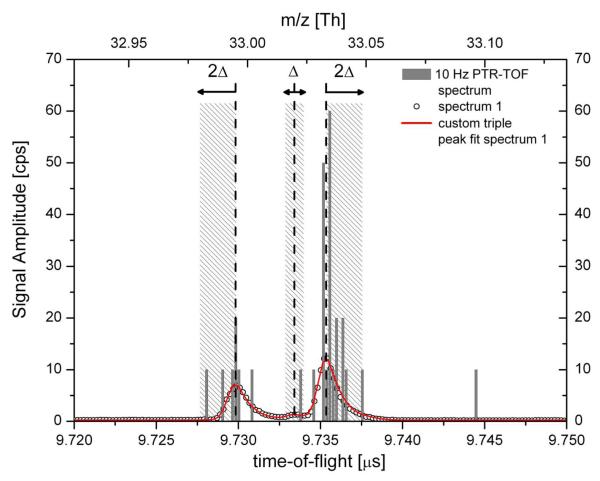
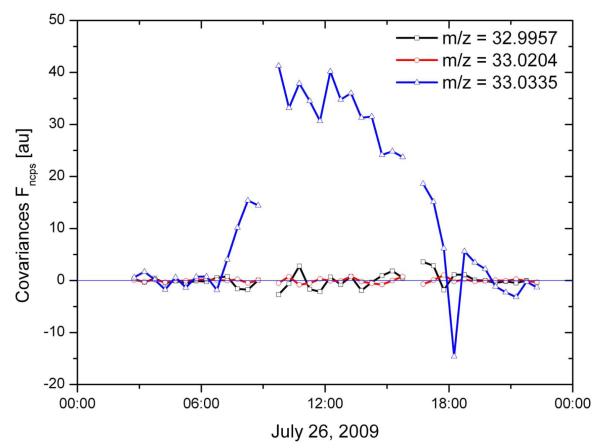
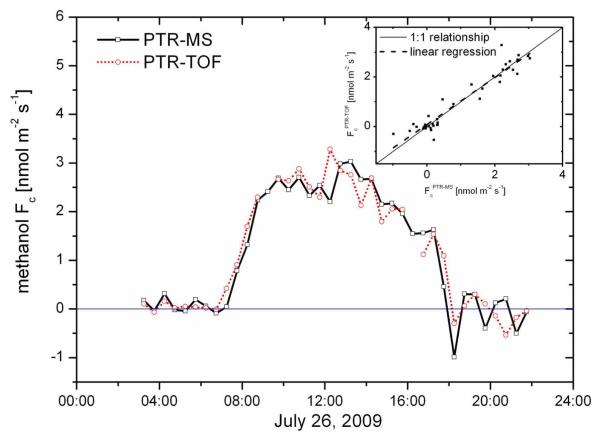
The recently developed PTR-TOF instrument was evaluated to measure methanol fluxes emitted from grass land using the eddy covariance method. The high time resolution of the PTR-TOF allowed storing full mass spectra up to m/z 315 with a frequency of 10 Hz. Three isobaric ions were found at a nominal mass of m/z 33 due to the high mass resolving power of the PTR-TOF. Only one of the three peaks contributed to eddy covariance fluxes. The exact mass of this peak agrees well with the exact mass of protonated methanol (m/z 33.0335). The eddy covariance methanol fluxes measured with PTR-TOF were compared to virtual disjunct eddy covariance methanol fluxes simultaneously measured with a conventional PTR-MS. The methanol fluxes from both instruments show excellent agreement.
Figures
References
-
- Baldocchi DD. Assessing the eddy covariance technique for evaluating carbon dioxide exchange rates of ecosystems: past, present and future. Glob. Change Biol. 2003;9:479–492.
-
- Bamberger I, Hörtnagl L, Schnitzhofer R, Graus M, Ruuskanen TM, Müller M, Dunkl J, Wohlfahrt G, Hansel A. Long term BVOC fluxes above mountain grassland. Biogeosciences Discuss. 2010;7:83–110. http://www.biogeosciences-discuss.net/7/83/2010/ - PMC - PubMed
-
- Blake RS, Whyte C, Hughes CO, Ellis AM, Monks PS. Demonstration of Proton-Transfer Reaction Time-of-Flight Mass Spectrometry for Real-Time Analysis of Trace Volatile Organic Compounds. Anal. Chem. 2004;76:3841–3845. - PubMed
-
- Brown RS, Gilfrich NL. Design and performance of a matrix-assisted laser desorption time-of-flight mass spectrometer utilizing a pulsed nitrogen laser. Anal. Chim. Acta. 1991;248:541–552.
-
- Businger JA, Oncley SP. Flux Measurement with Conditional Sampling. J. Atmos. Oceanic Tech. 1990;7:349–352.
Grants and funding
LinkOut - more resources
Full Text Sources