. 2014 Feb;8(1):55-69.
doi: 10.1007/s11571-013-9263-z. Epub 2013 Jul 23.

A linear model for characterization of synchronization frequencies of neural networks

Affiliations

A linear model for characterization of synchronization frequencies of neural networks

Peili Lv et al. Cogn Neurodyn. 2014 Feb.

Abstract

The synchronization frequency of neural networks and its dynamics have important roles in deciphering the working mechanisms of the brain. It has been widely recognized that the properties of functional network synchronization and its dynamics are jointly determined by network topology, network connection strength, i.e., the connection strength of different edges in the network, and external input signals, among other factors. However, mathematical and computational characterization of the relationships between network synchronization frequency and these three important factors are still lacking. This paper presents a novel computational simulation framework to quantitatively characterize the relationships between neural network synchronization frequency and network attributes and input signals. Specifically, we constructed a series of neural networks including simulated small-world networks, real functional working memory network derived from functional magnetic resonance imaging, and real large-scale structural brain networks derived from diffusion tensor imaging, and performed synchronization simulations on these networks via the Izhikevich neuron spiking model. Our experiments demonstrate that both of the network synchronization strength and synchronization frequency change according to the combination of input signal frequency and network self-synchronization frequency. In particular, our extensive experiments show that the network synchronization frequency can be represented via a linear combination of the network self-synchronization frequency and the input signal frequency. This finding could be attributed to an intrinsically-preserved principle in different types of neural systems, offering novel insights into the working mechanism of neural systems.

Keywords: Izhikevich model; Neural networks; Neuroimaging; Synchronization frequency.


Figures

Fig. 1
Fig. 1
The framework of our experiment designs and approaches. Three steps are included in three dashed frames from the left to the right including network construction (step 1), network simulations (step 2), and quantitative relationship modeling (step 3). In Step 1, three types of neural networks were constructed including simulated small-world networks (top) (Watts and Strogatz 1998), working memory networks via fMRI data (middle) (Faraco et al. ; Zhu et al. 2011a), and structural brain networks via DTI data (bottom) (Zhu et al. 2012). In Step 2, self-synchronization and synchronization under external input signals are simulated on the neural networks. In Step 3, the quantitative relationships between network synchronization strength and frequency and self-synchronization frequency and input signal frequency are modeled
Fig. 2
Fig. 2
The hierarchical neural network simulation models used in our paper. Our strategy is to expand the model covering while simplifying the network structure
Fig. 3
Fig. 3
Stochastic fiber tracking and working memory network. a Joint visualization of the cortical surface and the probability map resulted from stochastic fiber tracking for two ROIs (represented by two blue spheres). b Visualization of the working memory network, the colorbar illustrated the connectivity strength z ij between ROI i and j. (Color figure online)
Fig. 4
Fig. 4
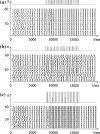
Illustration of the calculation of synchronization frequency. a A visualization of synchronization process in a neural network of 100 nodes. The average time interval between two spiking is 569.12 ms with standard deviation of 14.20 ms. b Number of neurons firing in a time interval (δ(t)) obtained from a. c δ(t) in b thresholded by λ = 0.6. d The radical frequency calculated from the Fourier transformation is 1.8 Hz. The radical frequency could represent the synchronization frequency truthfully
Fig. 5
Fig. 5
Synchrony pattern of the small-world network with the input strength of 10. The colorbar on the top shows the value of g. We can see an obvious zonary pattern. a Original synchrony pattern. b Synchrony pattern after thresholded by 0.5. c Linear regression results of the zonary zones in b
Fig. 6
Fig. 6
Synchrony pattern of the small-world network with the input strength of 30. The colorbar on the top shows the value of χ 2. a Original synchrony pattern. b Synchrony pattern after being thresholded by 0.5
Fig. 7
Fig. 7
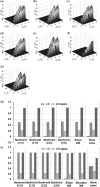
The synchronization pattern of different network models at weak input strength (g = 10). ad Small-world network model (small-worldness of 3.15, 2.75, 2.23, and 1.85 respectively); e Bilayer working memory network model; f Monolayer working memory network model; g The DICCCOL brain network model. h, i Fitting parameters of synchrony patterns with weak input strength (g = 10). The number in parentheses is the small-worldness value. h Fitting parameters of synchrony area II; i fitting parameters of synchrony area I
Fig. 8
Fig. 8
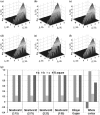
Synchronization pattern of different network models at strong input strength (g = 30). ad Small world network model (small-worldness of 3.15, 2.75, 2.23, and 1.85 respectively); e Bilayer working memory network model; f The DICCCOL network model. g Fitting parameters of synchrony patterns with strong input strength (g = 30)
Fig. 9
Fig. 9
Synchronization under different input schemes. The upper panel in each subplot is the input signal, dark dots indicate spiking of nodes without input signal, and red dots indicate spikings of nodes with input signal. a Weak input and matched frequency pair (f 1 = 4 Hz, f 0 = 1.87 Hz, f 1 ≈ 2f 0) lead to good synchronization (χ 2 = 0.52). b Weak input (g = 10) and unmatched frequency pair (f 1 = 2.86 Hz, f 0 = 1.87 Hz, f 1 = 1.53f 0) lead to poor synchronization (χ 2 = 0.35). c Strong input (g = 30) and unmatched frequency pair (f 1 = 2.86 Hz, f 0 = 1.87 Hz, f 1 = 1.53f 0) can also lead to good synchronization (χ 2 = 0.52)
Fig. 10
Fig. 10
The relationship between self-synchronization frequency (f 0), the input signal frequency (f 1) and synchronization frequency (f 2), with strong input strength (g = 10). ad Small-world network model (small-worldness of 3.15, 2.75, 2.23, and 1.85 respectively); e Bilayer working memory network model; f Monolayer working memory network model; g DICCCOL brain network model. h, i Fitting parameters of synchrony frequencies with weak input strength (g = 10). Note that parameter a is near zero in most networks. h fitting parameters of synchrony area II; i fitting parameters of synchrony area I
Fig. 11
Fig. 11
The relationship between self-synchronization frequency (f 0), the input signal frequency (f 1) and synchronization frequency (f 2), with strong input strength (g = 30). ad Small-world network model (small-worldness of 3.15, 2.75, 2.23, and 1.85 respectively); e Bilayer working memory network model; f DICCCOL network model. g Fitting parameters of synchrony frequencies with strong input strength g = 30. Note that parameter a is near zero in most networks

Similar articles

Cited by

References

    1. Baddeley A, Della Sala S. Working memory and executive control. Philos Trans R Soc Lond B Biol Sci. 1996;351(1346):1397–1403. doi: 10.1098/rstb.1996.0123. - DOI - PubMed
    1. Bassett DS, Bullmore ED. Small-world brain networks. The neuroscientist. 2006;12(6):512–523. doi: 10.1177/1073858406293182. - DOI - PubMed
    1. Bear MF, Connors B, Paradiso M. Neuroscience: exploring the Brain. Philadelphia: Lippincott Williams & Wilkins; 2006.
    1. Behrens TEJ, Johansen-Berg H, Woolrich MW, Smith D. Non-invasive mapping of connections between human thalamus and cortex using diffusion imaging. Nat Neurosci. 2003;6(7):750–757. doi: 10.1038/nn1075. - DOI - PubMed
    1. Brette R, Rudolph M, Carnevale T. Simulation of networks of spiking neurons: a review of tools and strategies. J ComputNeurosci. 2007;23(3):349–398. - PMC - PubMed

LinkOut - more resources