

Genome-wide analysis of promoters: clustering by alignment and analysis of regular patterns
- PMID: 24465517
- PMCID: PMC3898993
- DOI: 10.1371/journal.pone.0085260
Genome-wide analysis of promoters: clustering by alignment and analysis of regular patterns
Abstract
In this paper we perform a genome-wide analysis of H. sapiens promoters. To this aim, we developed and combined two mathematical methods that allow us to (i) classify promoters into groups characterized by specific global structural features, and (ii) recover, in full generality, any regular sequence in the different classes of promoters. One of the main findings of this analysis is that H. sapiens promoters can be classified into three main groups. Two of them are distinguished by the prevalence of weak or strong nucleotides and are characterized by short compositionally biased sequences, while the most frequent regular sequences in the third group are strongly correlated with transposons. Taking advantage of the generality of these mathematical procedures, we have compared the promoter database of H. sapiens with those of other species. We have found that the above-mentioned features characterize also the evolutionary content appearing in mammalian promoters, at variance with ancestral species in the phylogenetic tree, that exhibit a definitely lower level of differentiation among promoters.
Conflict of interest statement
Figures


 of each of the four nucleotides A (black), T (blue), C (red) and G (green) as a function of the position
  along the promoter (0 corresponds to the TSS). Figure from .
 of each of the four nucleotides A (black), T (blue), C (red) and G (green) as a function of the position
  along the promoter (0 corresponds to the TSS).


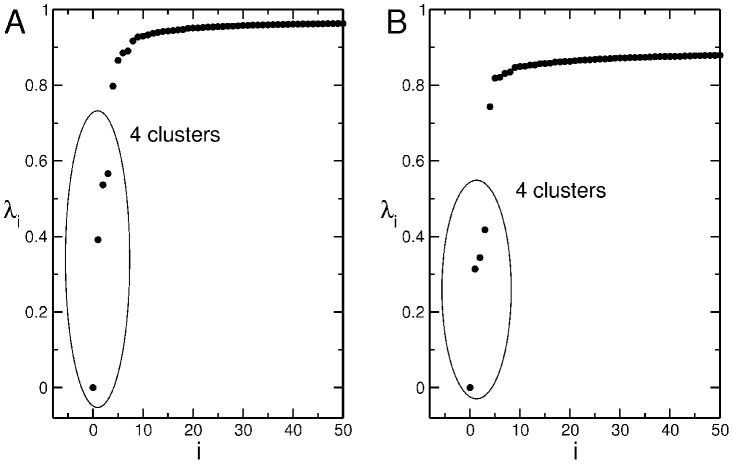
 eigenvalues in ascending order of the normalized Laplacian matrix relative to the alignment of 2880 H. sapiens promoters. The method used is the Needleman–Wunsch with GAPOPEN
 and GAPEXTEND
 for panel A, GAPEXTEND
 for panel B.
 , in panel A, has comparable values of participation number and extension (
 and
and  ), while the eigenvector
  , in panel B, has a small participation number,
  , but very large extension (
 ). In the insets an enlargement of the region of delocalization is shown. Data refer to the promoter of H. sapiens with Entrez GeneID 9542 (the promoter of the neuregulin-2 gene). Entrez Gene is the gene-specific database at the National Center of Biotechnology Information (NCBI) .

References
Publication types
MeSH terms
Substances
LinkOut - more resources
Full Text Sources
Other Literature Sources
