. 2014 Jan 22;9(1):e85591.
doi: 10.1371/journal.pone.0085591. eCollection 2014.

Genomic analyses reveal broad impact of miR-137 on genes associated with malignant transformation and neuronal differentiation in glioblastoma cells

Affiliations

Genomic analyses reveal broad impact of miR-137 on genes associated with malignant transformation and neuronal differentiation in glioblastoma cells

Saleh Tamim et al. PLoS One. .

Abstract

miR-137 plays critical roles in the nervous system and tumor development; an increase in its expression is required for neuronal differentiation while its reduction is implicated in gliomagenesis. To evaluate the potential of miR-137 in glioblastoma therapy, we conducted genome-wide target mapping in glioblastoma cells by measuring the level of association between PABP and mRNAs in cells transfected with miR-137 mimics vs. controls via RIPSeq. Impact on mRNA levels was also measured by RNASeq. By combining the results of both experimental approaches, 1468 genes were found to be negatively impacted by miR-137--among them, 595 (40%) contain miR-137 predicted sites. The most relevant targets include oncogenic proteins and key players in neurogenesis like c-KIT, YBX1, AKT2, CDC42, CDK6 and TGFβ2. Interestingly, we observed that several identified miR-137 targets are also predicted to be regulated by miR-124, miR-128 and miR-7, which are equally implicated in neuronal differentiation and gliomagenesis. We suggest that the concomitant increase of these four miRNAs in neuronal stem cells or their repression in tumor cells could produce a robust regulatory effect with major consequences to neuronal differentiation and tumorigenesis.


Conflict of interest statement

Competing Interests: The authors have the following interests. Agnes Radek and Scott Kuersten are employed by Epicentre (An Illumina Company). This does not alter the authors' adherence to all the PLOS ONE policies on sharing data and materials.

Figures

Figure 1
Figure 1. Impact of miR-137 mimics transfection on cancer relevant processes.
A) miR-137 transfection into U251 glioblastoma cells inhibits cell proliferation (p<0.001, multiple comparison tests between groups). U251 cells were transfected with miR-137 or control miRNA and plated at a low density (500 cells per well). Cell proliferation was monitored using the Essen Bioscience IncuCyte automated microscope system and read out as percentage confluence. The experiment was monitored over a course of 6 days. The data was analyzed using analysis of variance, and the data is presented as the mean ± standard deviation. B) miR-137 transfection into U251 glioblastoma results in increased apoptosis, measured by caspase-3/-7 luminescent assay. Caspase-3/-7 activity, an indicator of apoptosis induction, increased after miR-137 transfection, as compared to the control miRNA transfection. Data was analyzed with Student's t-test and is presented as the mean ± standard deviation. *** indicates p≤0.001. C) miR-137 transfection into U251 glioblastoma cells results in increased apoptosis, measured by Western blot of poly(ADP) ribose polymerase (PARP) cleavage. PARP cleavage, an end event of apoptosis, increased after miR-137 transfection, as compared to the control miRNA transfection. Etoposide (25 µM) was used as an inducer of apoptosis. Data was analyzed with Student's t-test and is presented as the mean ± standard deviation. ** indicates p≤0.01. α-tubulin was included as an endogenous loading control. D) miR-137 transfection into glioblastoma cells results in decreased ability to migration (p<0.001, multiple comparison tests between groups). U251 glioblastoma cells were transfected with miR-137 or control miRNA. An in vitro scratch assay was used to measure the ability for cell migration. The assay was monitored using Essen Bioscience IncuCyte automated microscope system. The data was analyzed using analysis of variance, and the data is presented as the mean ± standard deviation.
Figure 2
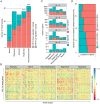
Figure 2. Analysis of miR-137 impact on glioblastoma expression by two genomic approaches.
A) Venn diagram shows the number of genes affected by miR-137 mimics transfection in U251 cells obtained by RNASeq and RIPSeq approaches. B) Venn diagram shows the number of genes identified by our approaches containing miR-137 predicted targets according to TargetScan, Miranda or Pictar. C) Hypergeometric test determined the significance of results of the two approaches used to identify miR-137 targets. D) Venn diagram shows the distribution of genes containing miR-137 predicated sites (from B) according to prediction tools. E) Venn diagram showing the number of genes identified by either the RIPSeq assay or the RNASeq assay in U251 cells, U343 cells, and both cell types. F) As in panel E, but considering only genes that were predicted as miR137 targets by Miranda, Pictar or TargetScan. G) Venn diagram showing the number of genes identified as miR137 targets in U343 cells by the RIPSeq assay, the RNASeq assay and both. H) As in panel G, but considering only genes that were predicted as miR137 targets by Miranda, Pictar or TargetScan. I) The average log10-fold-change in U251 cells (y-axis) and U343 cells (x-axis) is shown for all genes identified as miR137 targets by the RIPSeq assay in either U251 or U343 cells; genes (points) are colored by whether they were identified in only U251 cells, only U343 cells, or both. J) As in panel I, but for the RNASeq assay.
Figure 3
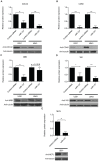
Figure 3. Validation of RNASeq and RIPSeq results by western analysis.
U251 and U343 cells were transfected with either miR-137 or control miRNA mimic. Western analyses show the impact on protein levels of a set of genes affected by miR-137 transfection according to RNASeq or RIPSeq analyses. Neurofilament was not detected in U343 cells. α-tubulin was included as an endogenous loading control. Data was analyzed with Student's t-test and is presented as the mean ± standard deviation. * indicates p≤0.05, ** indicates p≤0.01, and *** indicates p≤0.001.
Figure 4
Figure 4. Network analysis.
Genes negatively affected by miR-137 mimics transfection as determined by RIPSeq or RNASeq analyses which contain a miR-137 predicted site were connected using Ingenuity Pathway Analysis tool. Solid lines indicate direct interactions; dashed lines indicate indirect interactions. Genes from Table 1 are highlighted (open circle).
Figure 5
Figure 5. Expression analysis of miR-137 and its targets in the TCGA dataset.
A) Shown is the total number and proportion of TCGA samples analyzed with up- or down-regulation of miR137 (see methods for details). Error-bars are 95% confidence interval, and *** indicates p≤0.001, binomial test (two tailed, null hypothesis is a true proportion of 0.5). B) The z-score of gene expression in 261 TCGA samples for the 595 miR137 target genes relative to normal tissue, stratified by GBM type as reported by Kim et al. . C) The number and proportion of up/down regulated genes amongst the 595 identified miR137 target genes in 261 TCGA GBM samples. Four different thresholds for significant change are shown (absolute value of z-score relative to normal tissue greater than 2, 3, 4 or 5). Samples are stratified by GBM type (x-axis), as defined in Kim et al. ; if a gene is up or down regulated in multiple samples, it is counted once for each sample showing a significant change. D) Proportion of genes with positive or negative correlation with miR137 (x-axis) for increasing correlation coefficient threshold cut-offs (y-axis); higher correlations tend to be predominantly negative.
Figure 6
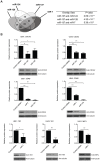
Figure 6. miR-137 potentially shares targets with miRNAs implicated in neurogenesis and gliomagenesis.
A) Venn diagram displays the potential overlap between miR-137 identified targets and predicted miR-7, -124 and -128 targets obtained from TargetScan, miRanda, and PicTar. Table indicates that overlaps are significant according to Hypergeometric test. B) U251 glioblastoma cells were transfected with either miR-7, miR-124, and miR-128 (as listed) or control mimics. Western analyses show the impact on protein levels of a set of genes affected by miR-7, miR-124, or miR-128 transfection that were identified by the bioinformatics analyses. Data was analyzed with Student's t-test and is presented as the mean ± standard deviation. * indicates p≤0.05, ** indicates p≤0.01, and *** indicates p≤0.001. Neurofilament was not detected in U343 cells.

Similar articles

Cited by

References

    1. Kim TM, Huang W, Park R, Park PJ, Johnson MD (2011) A developmental taxonomy of glioblastoma defined and maintained by MicroRNAs. Cancer Res 71: 3387–3399. - PMC - PubMed
    1. Sumazin P, Yang X, Chiu HS, Chung WJ, Iyer A, et al. (2011) An extensive microRNA-mediated network of RNA-RNA interactions regulates established oncogenic pathways in glioblastoma. Cell 147: 370–381. - PMC - PubMed
    1. Setty M, Helmy K, Khan AA, Silber J, Arvey A, et al. (2012) Inferring transcriptional and microRNA-mediated regulatory programs in glioblastoma. Mol Syst Biol 8: 605. - PMC - PubMed
    1. Gonzalez-Gomez P, Sanchez P, Mira H (2011) MicroRNAs as regulators of neural stem cell-related pathways in glioblastoma multiforme. Mol Neurobiol 44: 235–249. - PubMed
    1. Perruisseau-Carrier C, Jurga M, Forraz N, McGuckin CP (2011) miRNAs stem cell reprogramming for neuronal induction and differentiation. Mol Neurobiol 43: 215–227. - PubMed

Publication types

MeSH terms

Associated data