

Nuclear hormone receptor expression in mouse kidney and renal cell lines
- PMID: 24465611
- PMCID: PMC3899020
- DOI: 10.1371/journal.pone.0085594
Nuclear hormone receptor expression in mouse kidney and renal cell lines
Abstract
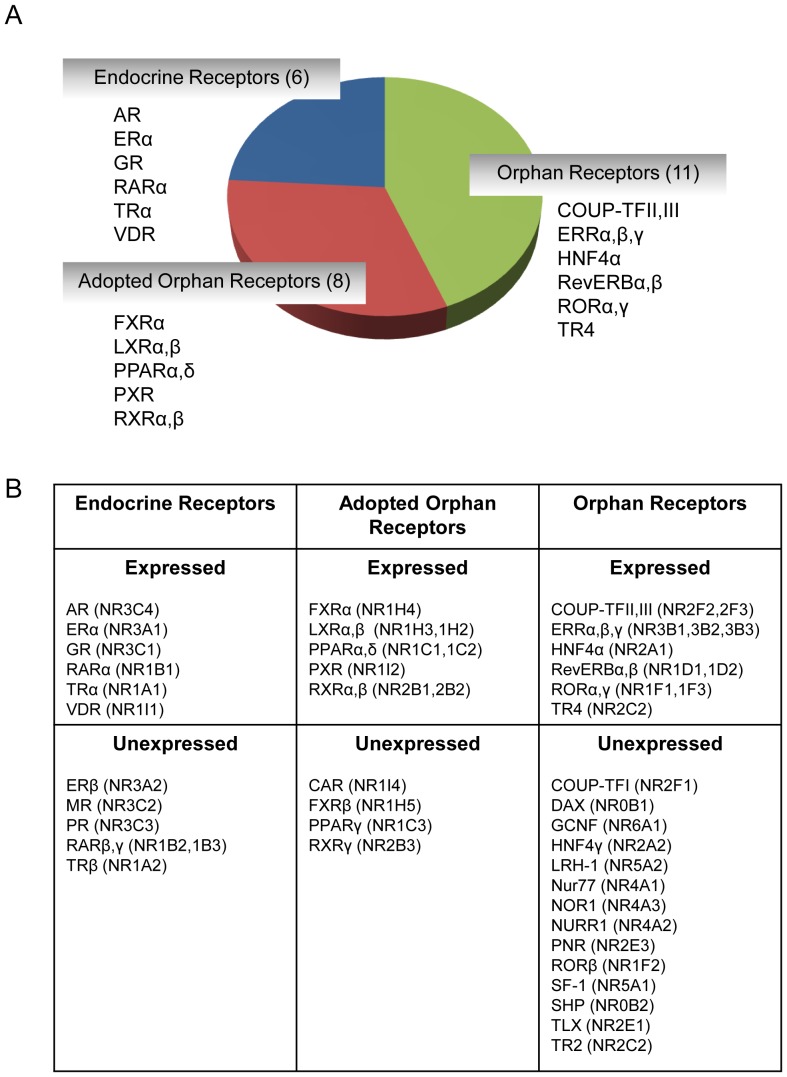
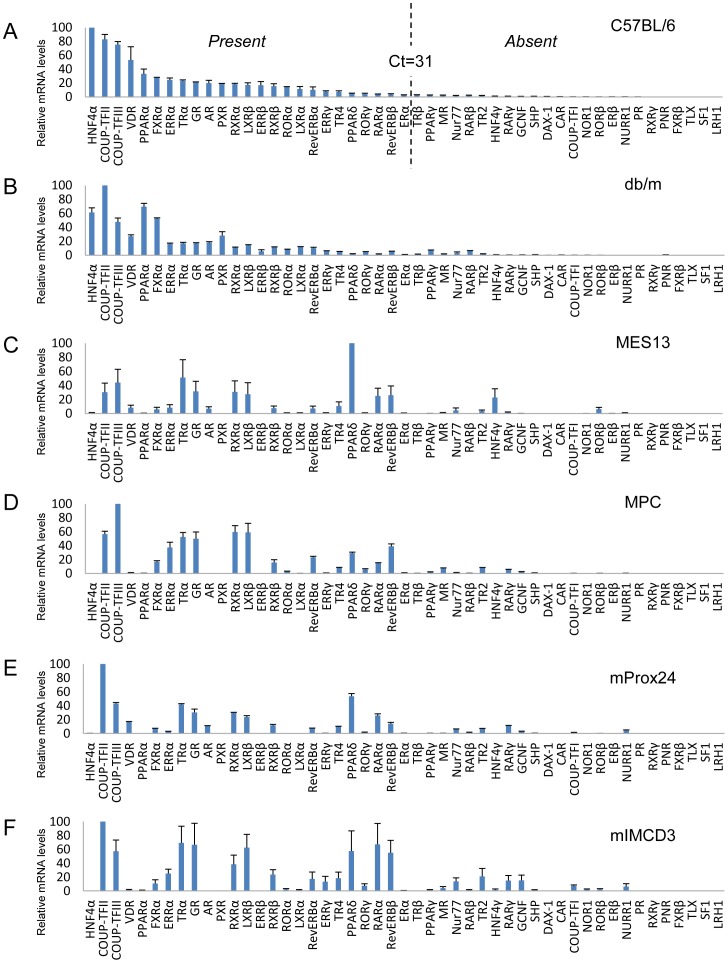
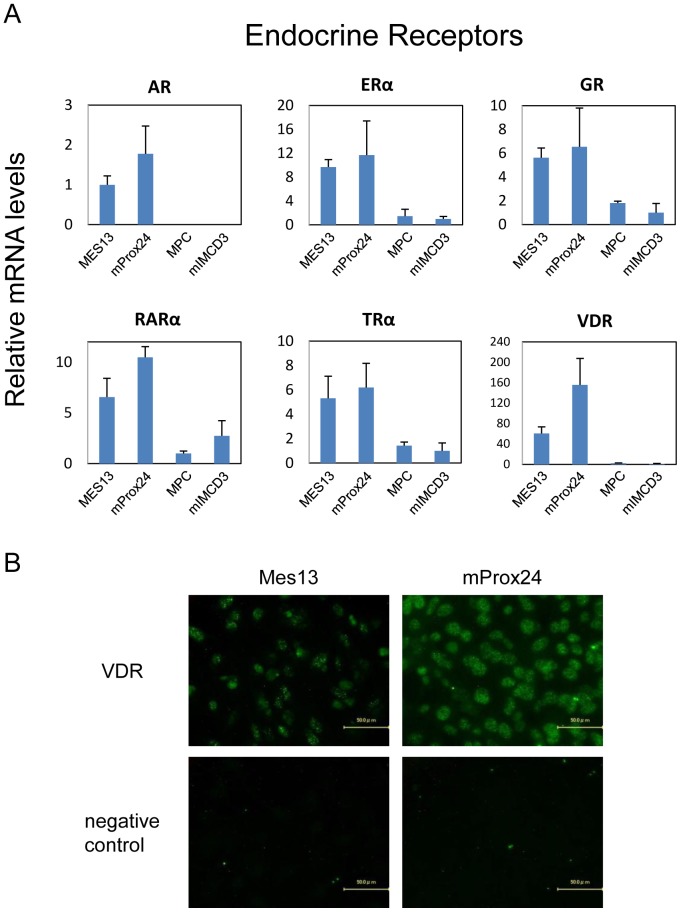
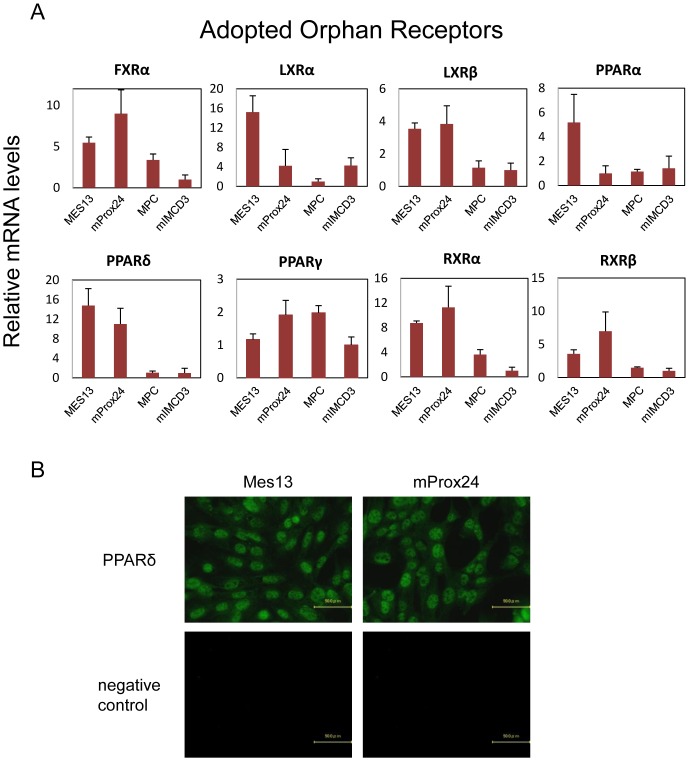
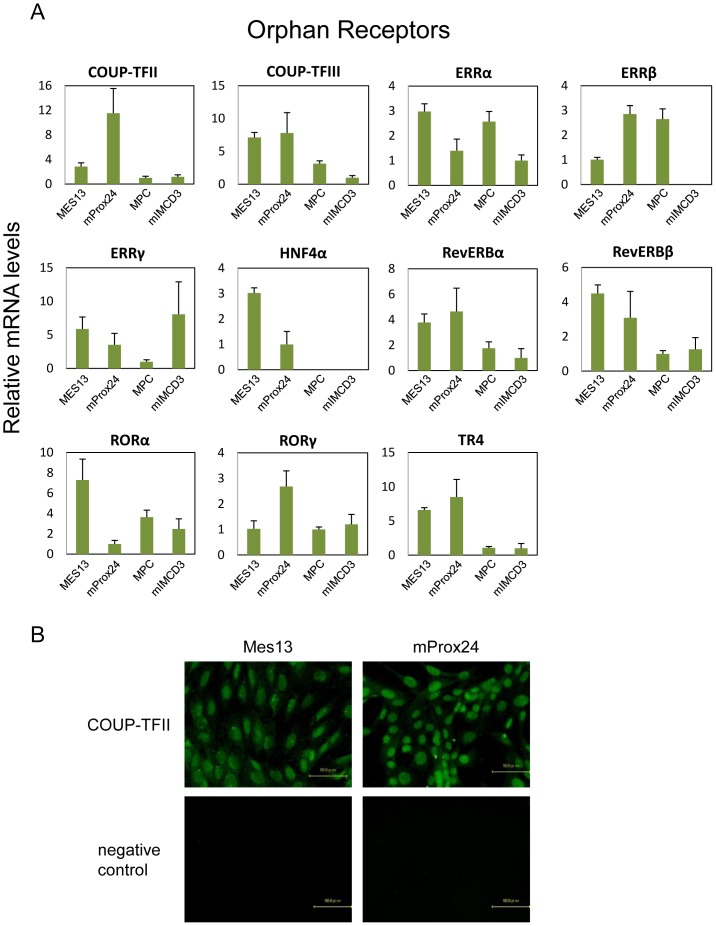
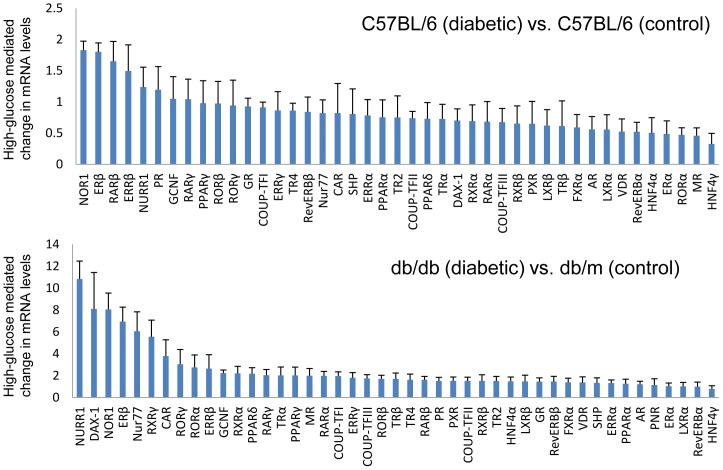
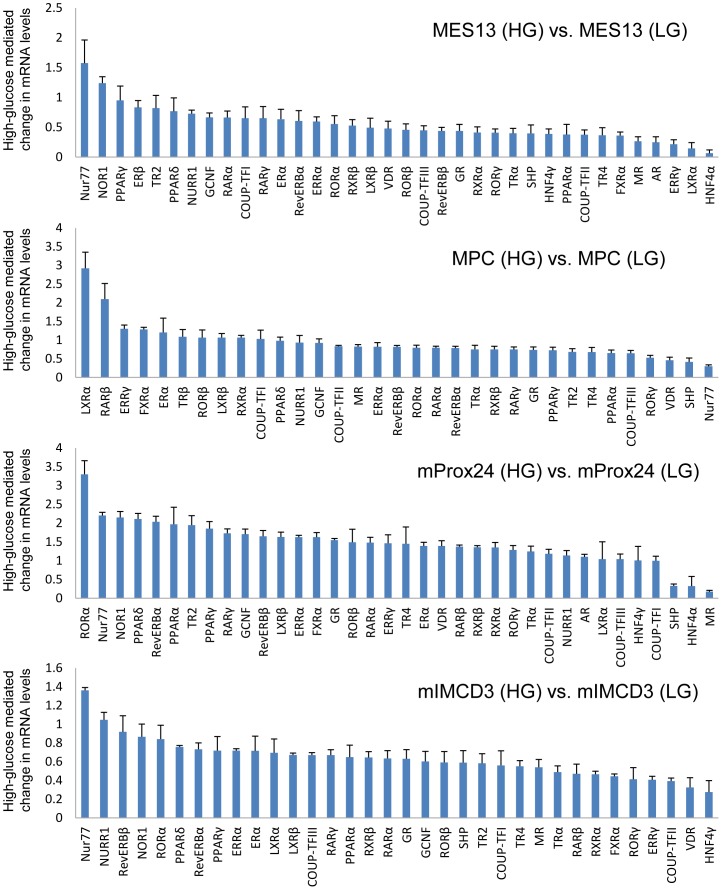
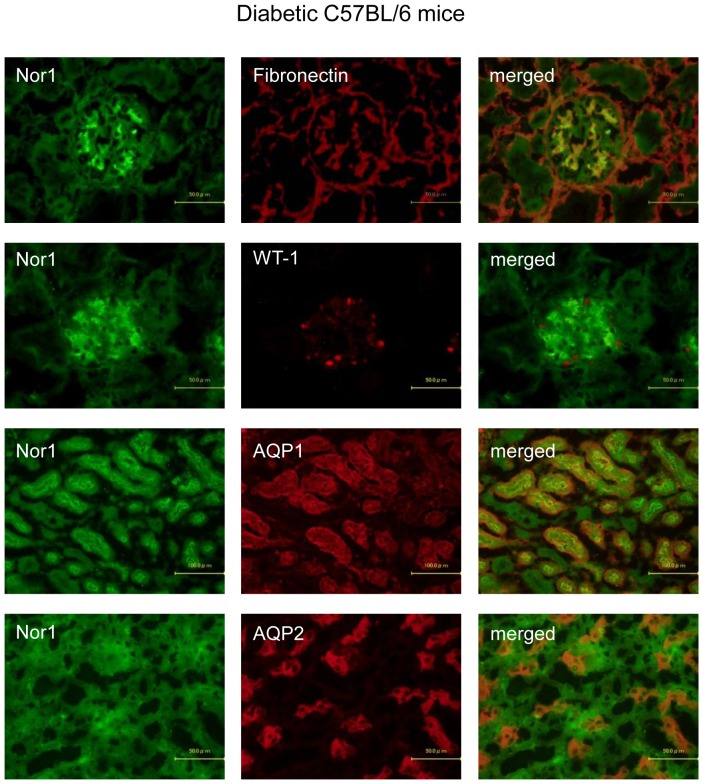
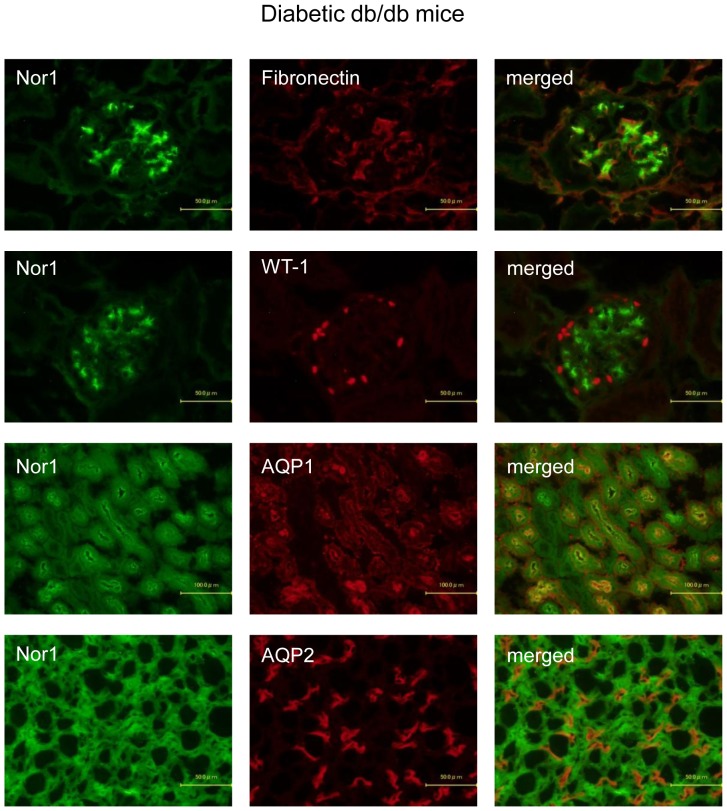
Nuclear hormone receptors (NHRs) are transcription factors that regulate carbohydrate and lipid metabolism, immune responses, and inflammation. Although several NHRs, including peroxisome proliferator-activated receptor-γ (PPARγ) and PPARα, demonstrate a renoprotective effect in the context of diabetic nephropathy (DN), the expression and role of other NHRs in the kidney are still unrecognized. To investigate potential roles of NHRs in the biology of the kidney, we used quantitative real-time polymerase chain reaction to profile the expression of all 49 members of the mouse NHR superfamily in mouse kidney tissue (C57BL/6 and db/m), and cell lines of mesangial (MES13), podocyte (MPC), proximal tubular epithelial (mProx24) and collecting duct (mIMCD3) origins in both normal and high-glucose conditions. In C57BL/6 mouse kidney cells, hepatocyte nuclear factor 4α, chicken ovalbumin upstream promoter transcription factor II (COUP-TFII) and COUP-TFIII were highly expressed. During hyperglycemia, the expression of the NHR 4A subgroup including neuron-derived clone 77 (Nur77), nuclear receptor-related factor 1, and neuron-derived orphan receptor 1 significantly increased in diabetic C57BL/6 and db/db mice. In renal cell lines, PPARδ was highly expressed in mesangial and proximal tubular epithelial cells, while COUP-TFs were highly expressed in podocytes, proximal tubular epithelial cells, and collecting duct cells. High-glucose conditions increased the expression of Nur77 in mesangial and collecting duct cells, and liver x receptor α in podocytes. These data demonstrate NHR expression in mouse kidney cells and cultured renal cell lines and suggest potential therapeutic targets in the kidney for the treatment of DN.
Conflict of interest statement
Figures
Similar articles
-
The expression profiles of nuclear receptors in the developing and adult kidney.Mol Endocrinol. 2006 Dec;20(12):3412-20. doi: 10.1210/me.2006-0312. Epub 2006 Sep 14. Mol Endocrinol. 2006. PMID: 16973757
-
A corepressor and chicken ovalbumin upstream promoter transcriptional factor proteins modulate peroxisome proliferator-activated receptor-gamma2/retinoid X receptor alpha-activated transcription from the murine lipoprotein lipase promoter.Endocrinology. 1999 Apr;140(4):1586-93. doi: 10.1210/endo.140.4.6653. Endocrinology. 1999. PMID: 10098492
-
Downregulation of liver X receptor-alpha in mouse kidney and HK-2 proximal tubular cells by LPS and cytokines.J Lipid Res. 2005 Nov;46(11):2377-87. doi: 10.1194/jlr.M500134-JLR200. Epub 2005 Aug 16. J Lipid Res. 2005. PMID: 16106051
-
Gene silencing by nuclear orphan receptors.Vitam Horm. 2004;68:1-48. doi: 10.1016/S0083-6729(04)68001-0. Vitam Horm. 2004. PMID: 15193450 Review.
-
COUP-TFII in Kidneys, from Embryos to Sick Adults.Diagnostics (Basel). 2022 May 9;12(5):1181. doi: 10.3390/diagnostics12051181. Diagnostics (Basel). 2022. PMID: 35626336 Free PMC article. Review.
Cited by
-
Mammalian Glutamyl Aminopeptidase Genes (ENPEP) and Proteins: Comparative Studies of a Major Contributor to Arterial Hypertension.J Data Mining Genomics Proteomics. 2017;8(2):2. doi: 10.4172/2153-0602.1000211. Epub 2017 Jun 13. J Data Mining Genomics Proteomics. 2017. PMID: 29900035 Free PMC article.
-
P2X7 receptor-nitric oxide interaction mediates apoptosis in mouse immortalized mesangial cells exposed to high glucose.J Bras Nefrol. 2022 Apr-Jun;44(2):147-154. doi: 10.1590/2175-8239-JBN-2021-0086. J Bras Nefrol. 2022. PMID: 34694316 Free PMC article.
-
Collecting duct cells show differential retinoic acid responses to acute versus chronic kidney injury stimuli.Sci Rep. 2020 Oct 7;10(1):16683. doi: 10.1038/s41598-020-73099-9. Sci Rep. 2020. PMID: 33028882 Free PMC article.
-
Mechanotransduction signaling in podocytes from fluid flow shear stress.Am J Physiol Renal Physiol. 2018 Jan 1;314(1):F22-F34. doi: 10.1152/ajprenal.00325.2017. Epub 2017 Sep 6. Am J Physiol Renal Physiol. 2018. PMID: 28877882 Free PMC article.
-
Estrogen receptor alpha differentially modulates host immunity in the bladder and kidney in response to urinary tract infection.Am J Clin Exp Urol. 2019 Jun 15;7(3):110-122. eCollection 2019. Am J Clin Exp Urol. 2019. PMID: 31317051 Free PMC article.
References
-
- Susztak K, Bottinger EP (2006) Diabetic nephropathy: a frontier for personalized medicine. J Am Soc Nephrol 17: 361–367. - PubMed
-
- Libby P, Plutzky J (2007) Inflammation in diabetes mellitus: role of peroxisome proliferator-activated receptor-alpha and peroxisome proliferator-activated receptor-gamma agonists. Am J Cardiol 99: 27B–40B. - PubMed
-
- Yang J, Zhou Y, Guan Y (2012) PPARgamma as a therapeutic target in diabetic nephropathy and other renal diseases. Curr Opin Nephrol Hypertens 21: 97–105. - PubMed
-
- Pistrosch F, Passauer J, Herbrig K, Schwanebeck U, Gross P, et al. (2012) Effect of thiazolidinedione treatment on proteinuria and renal hemodynamic in type 2 diabetic patients with overt nephropathy. Horm Metab Res 44: 914–918. - PubMed
Publication types
MeSH terms
Substances
LinkOut - more resources
Full Text Sources
Other Literature Sources
Medical
Miscellaneous
