

Expression pattern and biochemical properties of zebrafish N-acetylglutamate synthase
- PMID: 24465614
- PMCID: PMC3899043
- DOI: 10.1371/journal.pone.0085597
Expression pattern and biochemical properties of zebrafish N-acetylglutamate synthase
Abstract
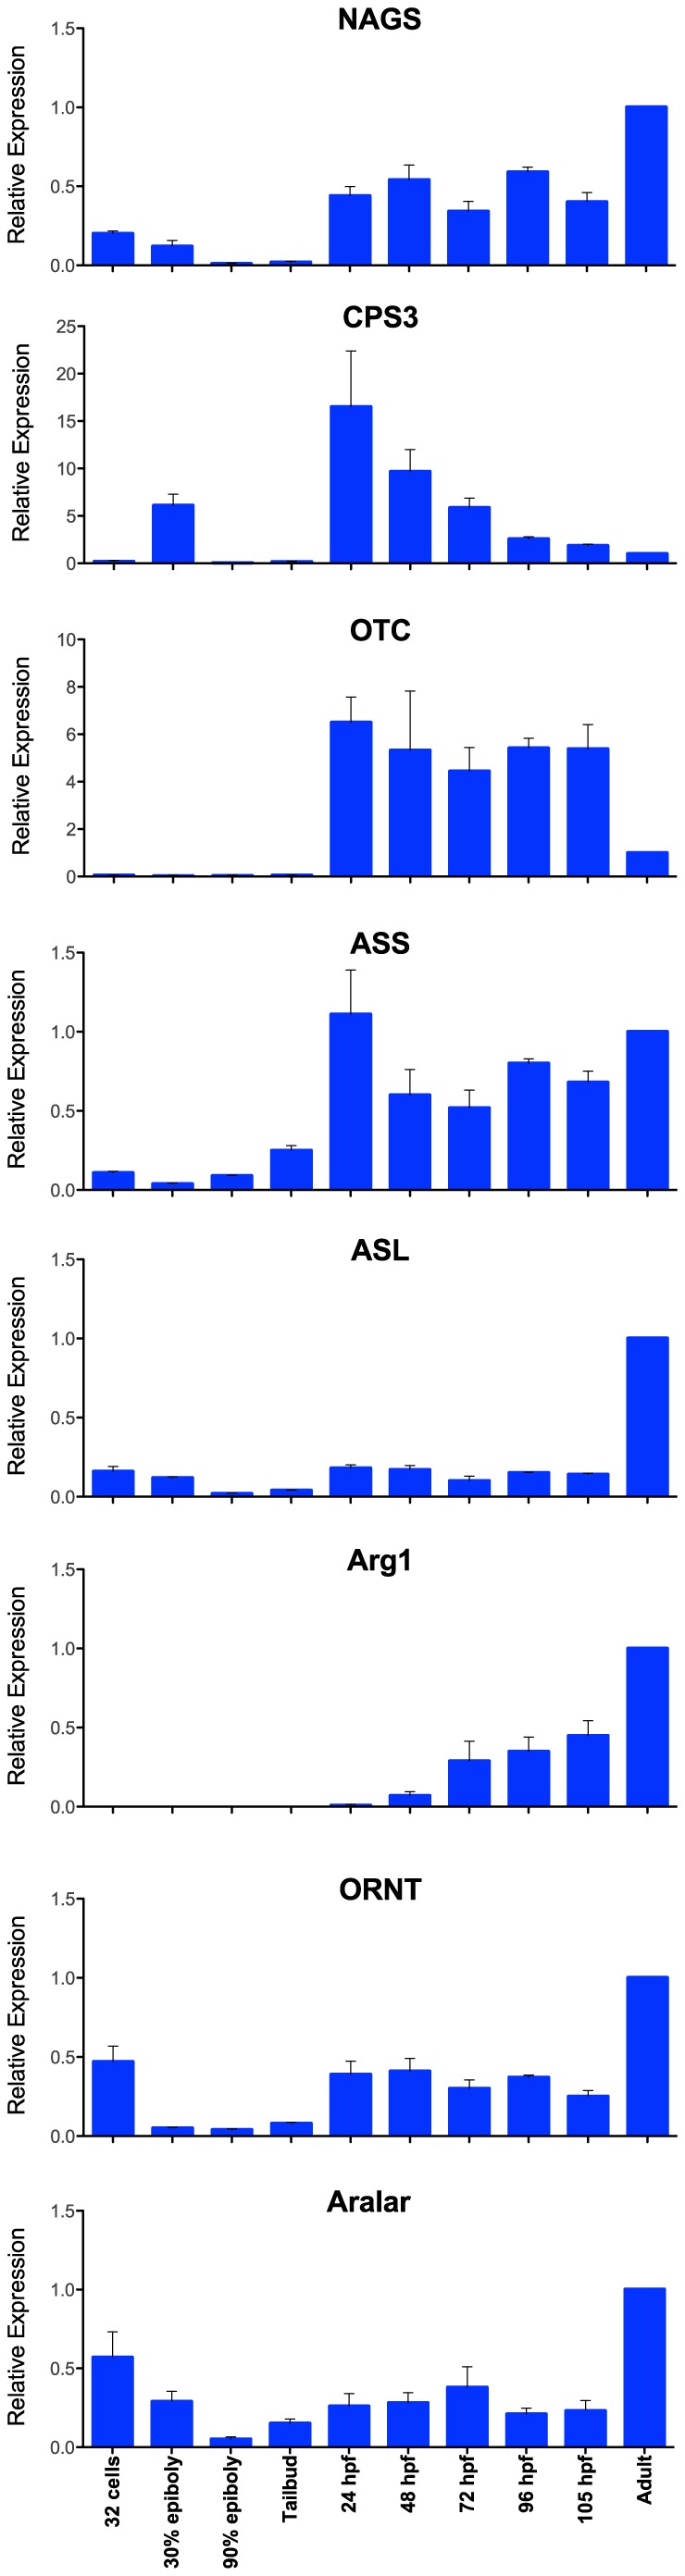
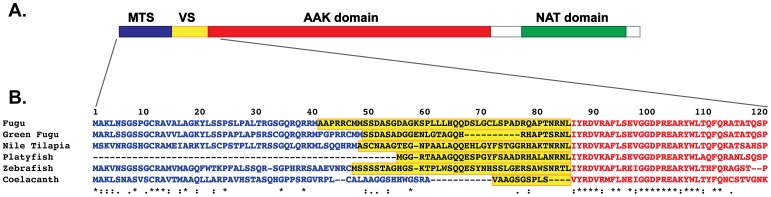
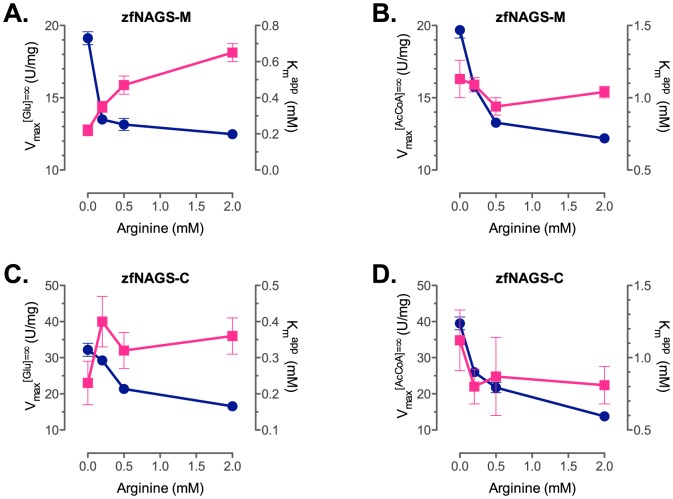
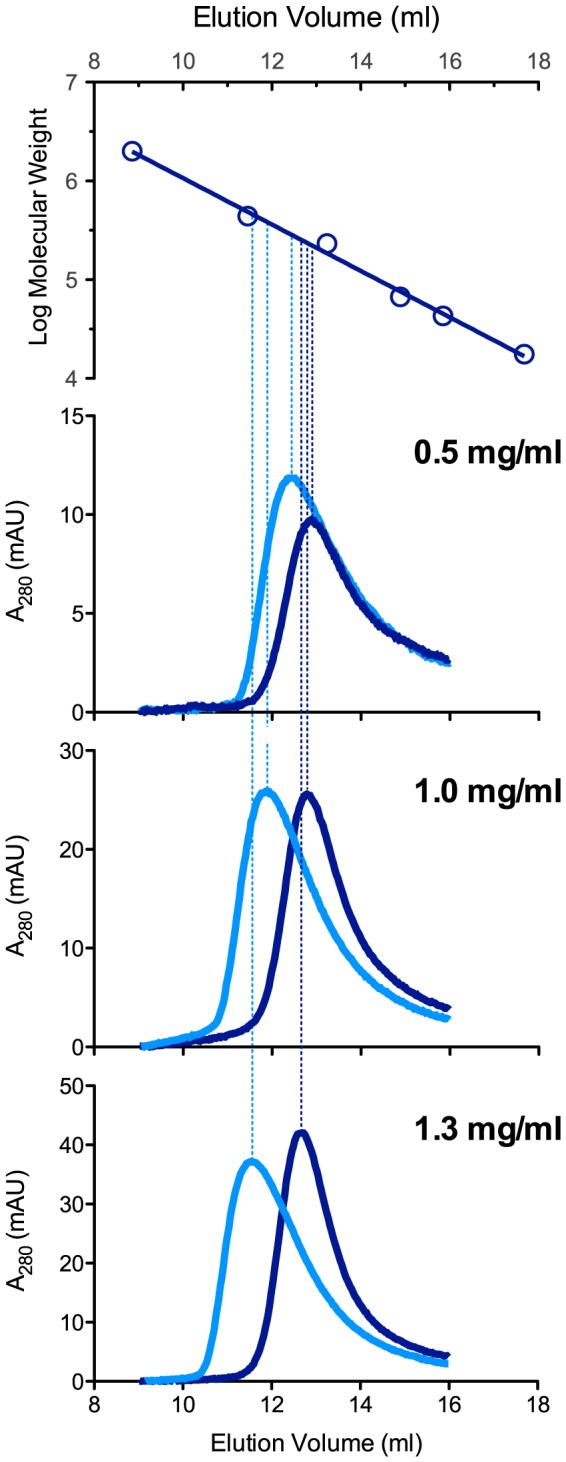
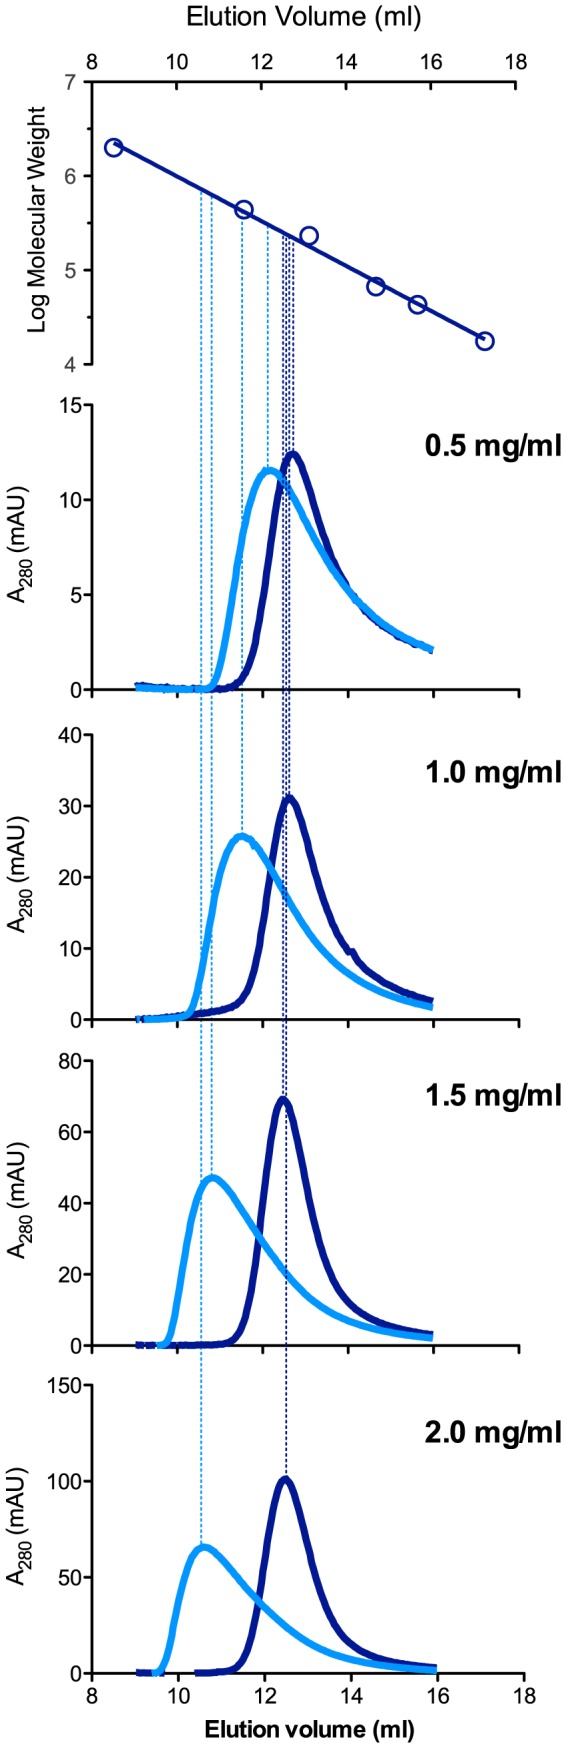
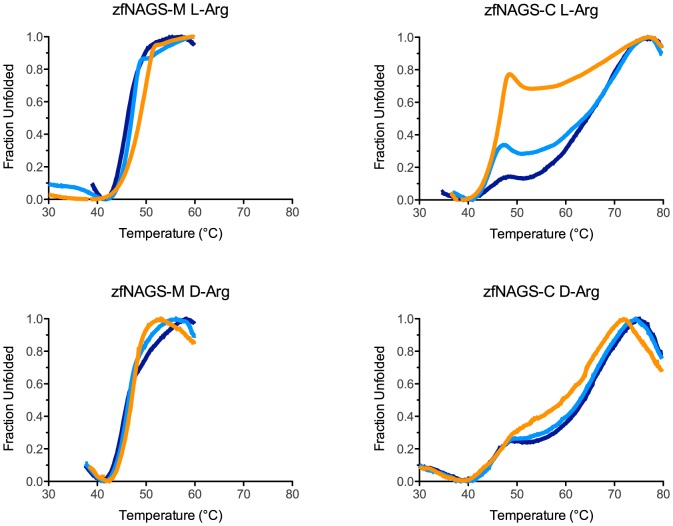
The urea cycle converts ammonia, a waste product of protein catabolism, into urea. Because fish dispose ammonia directly into water, the role of the urea cycle in fish remains unknown. Six enzymes, N-acetylglutamate synthase (NAGS), carbamylphosphate synthetase III, ornithine transcarbamylase, argininosuccinate synthase, argininosuccinate lyase and arginase 1, and two membrane transporters, ornithine transporter and aralar, comprise the urea cycle. The genes for all six enzymes and both transporters are present in the zebrafish genome. NAGS (EC 2.3.1.1) catalyzes the formation of N-acetylglutamate from glutamate and acetyl coenzyme A and in zebrafish is partially inhibited by L-arginine. NAGS and other urea cycle genes are highly expressed during the first four days of zebrafish development. Sequence alignment of NAGS proteins from six fish species revealed three regions of sequence conservation: the mitochondrial targeting signal (MTS) at the N-terminus, followed by the variable and conserved segments. Removal of the MTS yields mature zebrafish NAGS (zfNAGS-M) while removal of the variable segment from zfNAGS-M results in conserved NAGS (zfNAGS-C). Both zfNAGS-M and zfNAGS-C are tetramers in the absence of L-arginine; addition of L-arginine decreased partition coefficients of both proteins. The zfNAGS-C unfolds over a broader temperature range and has higher specific activity than zfNAGS-M. In the presence of L-arginine the apparent Vmax of zfNAGS-M and zfNAGS-C decreased, their Km(app) for acetyl coenzyme A increased while the Km(app) for glutamate remained unchanged. The expression pattern of NAGS and other urea cycle genes in developing zebrafish suggests that they may have a role in citrulline and/or arginine biosynthesis during the first day of development and in ammonia detoxification thereafter. Biophysical and biochemical properties of zebrafish NAGS suggest that the variable segment may stabilize a tetrameric state of zfNAGS-M and that under physiological conditions zebrafish NAGS catalyzes formation of N-acetylglutamate at the maximal rate.
Conflict of interest statement
Figures
Similar articles
-
Gene delivery corrects N-acetylglutamate synthase deficiency and enables insights in the physiological impact of L-arginine activation of N-acetylglutamate synthase.Sci Rep. 2021 Feb 11;11(1):3580. doi: 10.1038/s41598-021-82994-8. Sci Rep. 2021. PMID: 33574402 Free PMC article.
-
A novel bifunctional N-acetylglutamate synthase-kinase from Xanthomonas campestris that is closely related to mammalian N-acetylglutamate synthase.BMC Biochem. 2007 Apr 10;8:4. doi: 10.1186/1471-2091-8-4. BMC Biochem. 2007. PMID: 17425781 Free PMC article.
-
Inversion of allosteric effect of arginine on N-acetylglutamate synthase, a molecular marker for evolution of tetrapods.BMC Biochem. 2008 Sep 18;9:24. doi: 10.1186/1471-2091-9-24. BMC Biochem. 2008. PMID: 18801197 Free PMC article.
-
The N-Acetylglutamate Synthase Family: Structures, Function and Mechanisms.Int J Mol Sci. 2015 Jun 9;16(6):13004-22. doi: 10.3390/ijms160613004. Int J Mol Sci. 2015. PMID: 26068232 Free PMC article. Review.
-
N-acetylglutamate synthase: structure, function and defects.Mol Genet Metab. 2010;100 Suppl 1(Suppl 1):S13-9. doi: 10.1016/j.ymgme.2010.02.018. Epub 2010 Feb 26. Mol Genet Metab. 2010. PMID: 20303810 Free PMC article. Review.
Cited by
-
Arginine metabolism and its functions in growth, nutrient utilization, and immunonutrition of fish.Anim Nutr. 2021 Sep;7(3):716-727. doi: 10.1016/j.aninu.2021.03.006. Epub 2021 Jun 22. Anim Nutr. 2021. PMID: 34466676 Free PMC article. Review.
-
Mitochondrial Enzymes of the Urea Cycle Cluster at the Inner Mitochondrial Membrane.Front Physiol. 2021 Jan 21;11:542950. doi: 10.3389/fphys.2020.542950. eCollection 2020. Front Physiol. 2021. PMID: 33551825 Free PMC article.
-
A zebrafish model of hyperammonemia.Mol Genet Metab. 2014 Sep-Oct;113(1-2):142-7. doi: 10.1016/j.ymgme.2014.07.001. Epub 2014 Jul 10. Mol Genet Metab. 2014. PMID: 25069822 Free PMC article.
-
Acute hypoxia elevates arginase 2 and induces polyamine stress response in zebrafish via evolutionarily conserved mechanism.Cell Mol Life Sci. 2021 Dec 16;79(1):41. doi: 10.1007/s00018-021-04043-x. Cell Mol Life Sci. 2021. PMID: 34913090 Free PMC article.
-
Gene delivery corrects N-acetylglutamate synthase deficiency and enables insights in the physiological impact of L-arginine activation of N-acetylglutamate synthase.Sci Rep. 2021 Feb 11;11(1):3580. doi: 10.1038/s41598-021-82994-8. Sci Rep. 2021. PMID: 33574402 Free PMC article.
References
-
- Brusilow SW, Maestri NE (1996) Urea cycle disorders: diagnosis, pathophysiology, and therapy. Adv Pediatr 43: 127–170. - PubMed
-
- Atkinson BG (1995) Molecular aspects of ureagenesis in amphibians. In: Walsh PJ, Wright P, editors. Nitrogen Excretion and Metabolism. Boca Raton: CRC Press, Inc. pp. 133–146.
-
- Carlisky NJ, Barrio A (1972) Nitrogen metabolism of the South American lungfish Lepidosiren paradoxa. Comp Biochem Physiol B 41: 857–873. - PubMed
Publication types
MeSH terms
Substances
Grants and funding
LinkOut - more resources
Full Text Sources
Other Literature Sources
Molecular Biology Databases
Research Materials
